
Objective:
To evaluate the agronomic performance of winter wheat with combinations of varieties (soft whites vs. hard reds), populations, and nitrogen fertilizer rates in northwestern Montana.
Personnel:
C. Beiermann, J. Pavelka, J. Torrion, D. Larson
Summary:
The study consisted of 48 entries that were a combination of four varieties (Keldin, Jet, WB1529, WB1720) with four different seeding rates (16, 24, 32,40 plts/ft2) and three different nitrogen application rates (120, 180, and 250 lbs./acre). This study received 10.2 inches of rain with an additional 4.5 inches of irrigation. Cultural practices can be found in Table 1.
Table 1. Management Information
| Seeding date: | 9/27/2022 (270) | Field Location: | R4 |
| Seeding rate: | 16-40 plt/ft2 | Harvest date: | 8/3/2023 (215) |
| Previous crop: | Canola | Soil type: | Flathead Fine Sandy Loam |
| Herbicide: | Axial Bold, Cleansweep | Tillage: | Conventional |
| Insecticide: | N/A | Soil residual nutrient (N, P, K lbs/A) | 30, 4, 49 |
| Fungicide: | N/A | Nutrient fertilizer applied (N, P, K, lb/A) | (90.5-150.5-220.5), 50, 90 |
Here, the 2023 data are presented along with the 2022 data for comparison (Figure 1). Overall, the 2023 crop year had a lower yield than the 2022 crop year. These years were different, with 2022 having an extended cool spring, while 2023 had an early rise in temperature. There was no significant difference in yield with the levels of N for 2022 (Figure 1.) For 2023, a response in yield was observed with N up to 180 lbs. and no differences were observed between 180 and 250 lbs. of total N. Also, no differences were observed in protein with N levels in 2023 and the average protein was 11.7%.
For 2023 there were no differences in yields for winter wheat varieties nor classes tested (Hard reds: Jet and Keldin; soft whites, WB 1529, WB 1720). Average yield in 2023 was 114 bushels/acre. The falling numbers (FN) for this experiment are well above 350 seconds, which are not concerning this year. FN values for soft white classes were lower than the hard reds as expected, but FN >350 seconds.
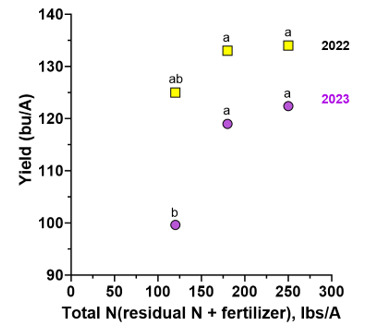
Figure 1. Yearly yields with the various N treatments. The same letter assignment denotes insignificant difference between N levels within a year at α=0.05.
Keldin and WB 1720 had the highest protein (Figure 2). The soft white varieties (WB 1529 and WB 17200) had protein greater than 11%. The acceptable protein for the soft white market class is 8.5-10.5%. One can afford to reduce N input in managing soft white winter wheat compared to hard reds. That way, grain protein levels for soft whites can be lowered considering that grain yield did not differ in 2022 for all the N treatments (Figure 1) except in 2023 which had a warmer, drier spring.
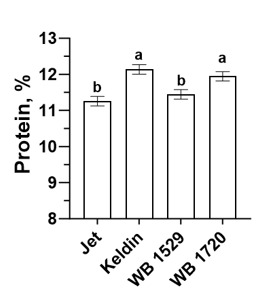
Figure 2. 2023 grain protein percentage. The same letter assessment denotes an insignificant difference between varieties at a=0.05.
The optimal seeding rate in 2022 was 25 live seeds/ft2 (using the regression model in Figure 3). This is consistent with our spring wheat studies’ optimal 24 live seeds/ft2. However, in 2023, the optimal seeding rate was 32 seeds/ft2 (Figure 3), which is related to the plant mortality rates. The actual plant counted before harvest for the seeding rate of 32 seeds/ft2 was 23 plants- similar to the 2022 data and spring wheat data (not shown). It is also important to note that plant mortality in 2023 indicated that the more seeds sown, the greater the mortality (Table 2). There was zero mortality in the lowest seeding rate.
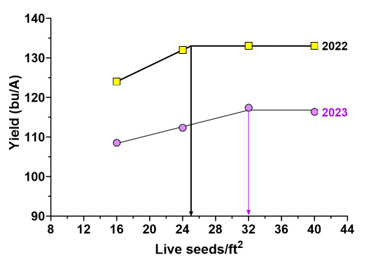
Figure 3. Yearly yields with various seeding rates. The same letter assignments denote an insignificant difference between seeding rates with a year at a=0.05.
Table 2. Plant loss and survival in 2023, Creston, MT
| Seeding rate (live seeds/ft2) | Pre-harvest count (plants/ft2) | % Plant mortality | % Plant survival |
|---|---|---|---|
| 16 | 17.8 | 0 | 100 |
| 24 | 17.9 | 25 | 75 |
| 32 | 23.1 | 28 | 72 |
| 40 | 24.6 | 39 | 61 |
Conclusions:
Reduced N input when managing soft white winter wheat is recommended, compared to the hard red counterparts. This is true for both years of the study. We observed that plant mortality increased as seeding rate increased. The recommended seeding rate is 24-32 live seeds/ft2 for winter wheat when a 20% mortality rate is assumed. A producer can reduce nitrogen cost for either market class. Our data suggest that 1 lb. of N per bushel of yield is too great of an economic risk. Choosing to plant soft white winter wheat can further save nitrogen costs as this class has lower grain protein market requirement.