
Response of Egan Spring Wheat to Nitrogen and Irrigation - 2016
Objective:
To evaluate nitrogen and water inputs response of Egan spring wheat yield and quality.
Personnel:
Jessica A. Torrion, John Garner
Methods:
Egan spring wheat was grown under four nitrogen levels and four irrigation levels as a strip-split plot, randomized complete block design with four replications, where irrigation levels represent the whole plot factor, and nitrogen as a strip factor. Irrigation treatments included 50 percent evapotranspiration (ET), 75ET, 100ET, and a rainfed check. The four nitrogen treatments included an unfertilized check for N, 52, 102, and 152 lbs/A added nitrogen. The check had an initial 98 lbs/A soil N. The resulting total N for the treatments were 98 (check), 150, 200, and 250 Total lb of N per acre. For simplicity, treatments are labeled as Total N and not added N.
Table 1. Management Information.
| Seeding Date: | 4/22/16 | Harvest Date: | 8/18/16 |
| Julian Date: | 113 | Julian Date: | 231 |
| Seeding Rate: | 25 plnts/sqft | Irrigation: | Yes |
| Tillage: | Conventional | Soil Type: | Fine Sandy Loam |
| Soil Test: | 57-10-95 | Fertilizer: | ___-63-148 |
| Herbicide: | 5/17/16 Huskie 11 floz/A + Axial 16.5 floz/A |
Insecticide: | 6/27/16 1.92 floz/A Warrior II |
Summary:
Nitrogen treatments had no significant effect on yield, but irrigation treatments did (Fig.1). Yield of 50ET was equivalent to 75ET or 100ET which means that the supposedly deficit 50ET had not affected Egan’s yield. The smaller amount of irrigation applied at each of the irrigation events must have improved the capture and storage of rainfall events occurred in between irrigation events. This strategy, however, can be adapted with care.
Protein responded with N applied until 200 lbs total N treatment. Egan has a high falling number and any effect by either irrigation or nitrogen is less of a concern. This one-year-only preliminary data suggests that for adjusted gross income, one should stay within 98-150 lbs total N/A and the conservative and risky 50ET irrigation application as long as it is done right.
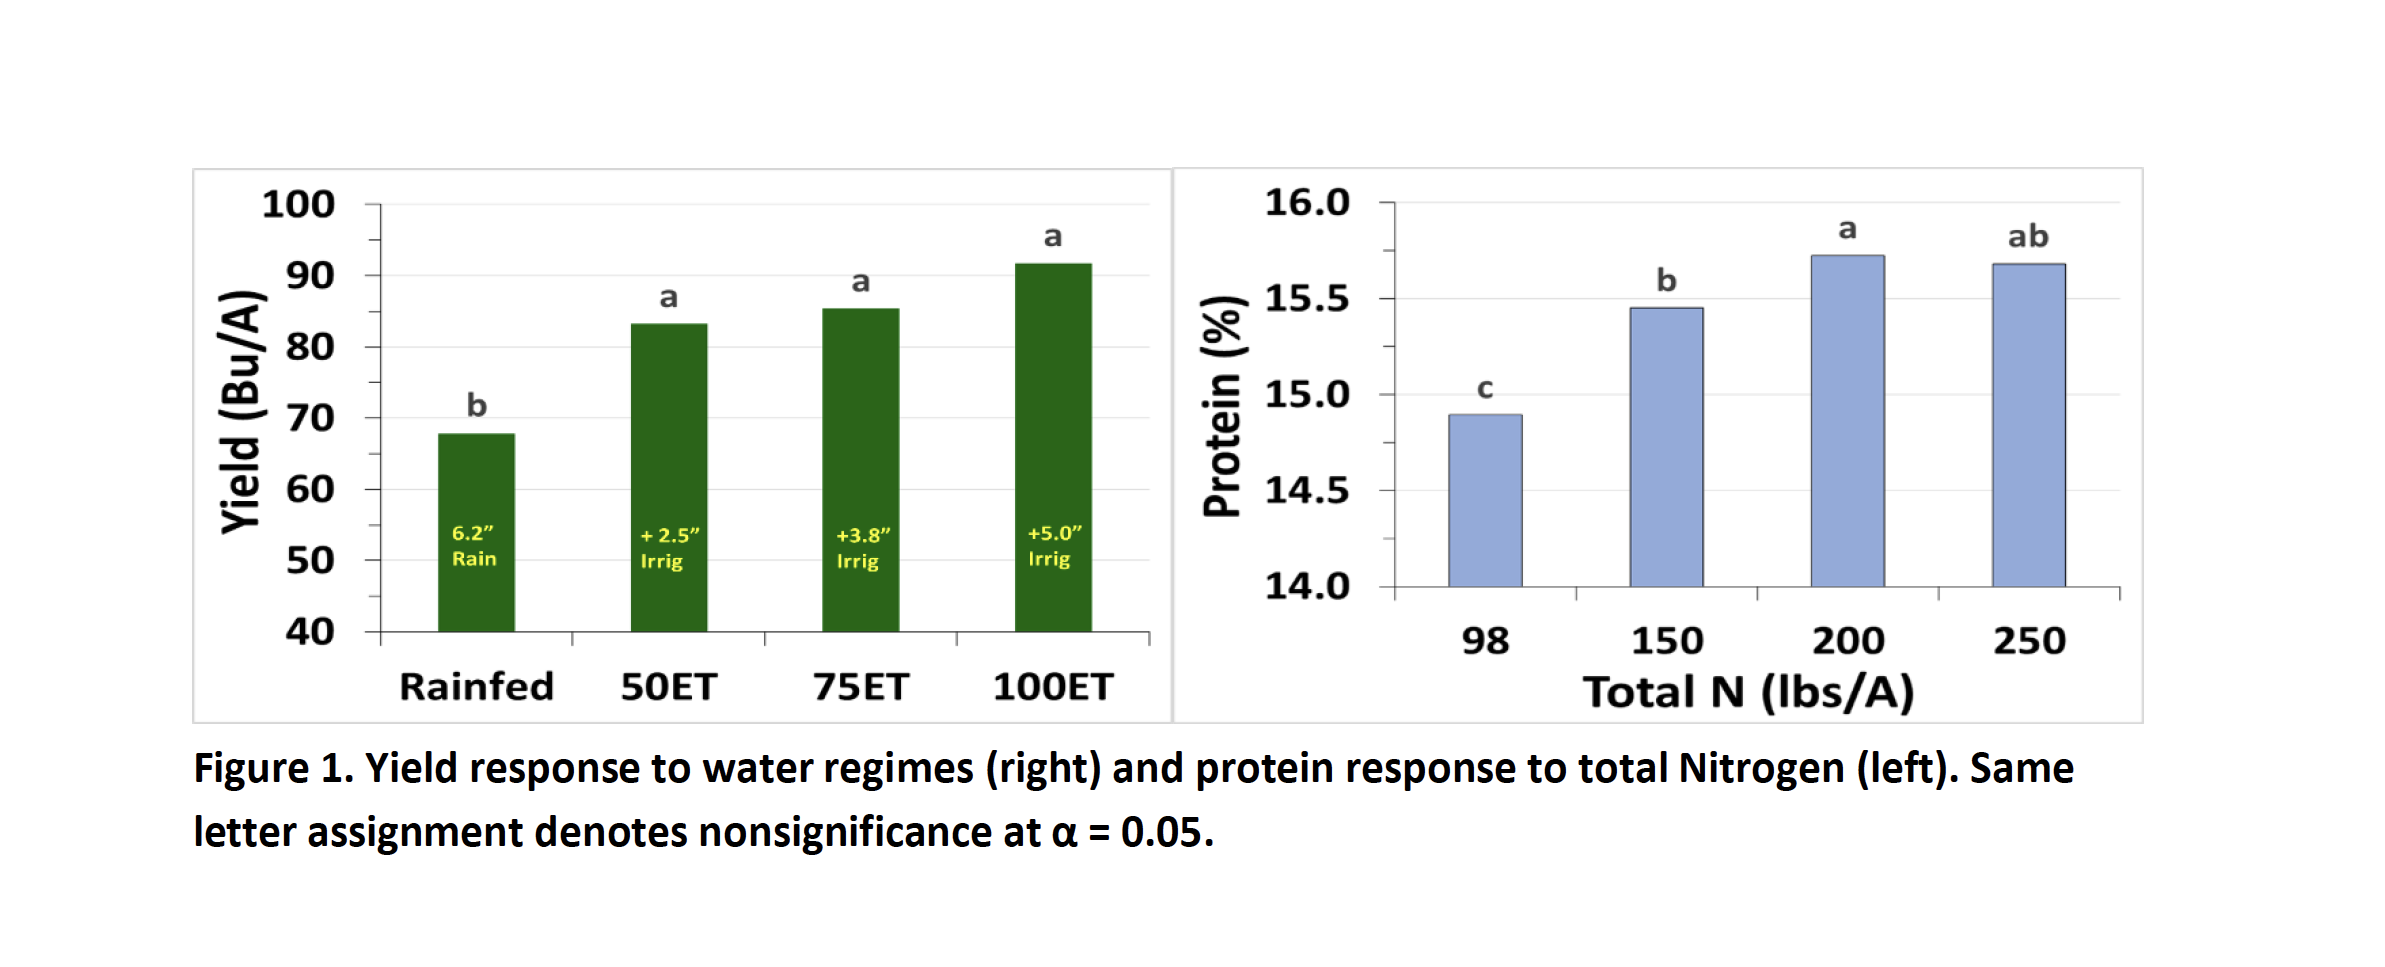
Table 2. Detailed data of the Nitrogen and irrigation effects on Egan spring wheat agronomic performance
| Total Nitrogen lbs/A |
HT in | YLD bu/A | PRO % | TWT lb/bu | TKW g | FN sec |
| Rainfed | ||||||
| 98 | 35.3 | 66.1 | 15.18 | 61.5 | 39.5 | 537.5 |
| 150 | 35.5 | 69.1 | 15.45 | 61.5 | 39.6 | 208.8 |
| 200 | 35.3 | 65.4 | 15.58 | 61.2 | 39.8 | 507.3 |
| 250 | 35.3 | 70.9 | 15.53 | 61.0 | 38.6 | 526.3 |
| Deficit Irrigation (50 ET) | ||||||
| 98 | 37.5 | 86.7 | 14.53 | 62.5 | 43.1 | 521.3 |
| 150 | 37.3 | 83.9 | 15.38 | 62.3 | 42.9 | 509.5 |
| 200 | 37.3 | 75.0 | 15.75 | 62.1 | 43.0 | 487.0 |
| 250 | 37.5 | 87.1 | 15.85 | 62.1 | 42.8 | 500.0 |
| Slightly Deficit Irrigation (75 ET) | ||||||
| 98 | 37.3 | 85.2 | 14.90 | 62.4 | 42.6 | 507.3 |
| 150 | 37.3 | 86.2 | 15.43 | 62.5 | 43.3 | 510.8 |
| 200 | 36.3 | 82.0 | 15.83 | 62.4 | 42.9 | 488.0 |
| 250 | 37.8 | 88.0 | 15.70 | 62.1 | 42.2 | 475.8 |
| Full Irrigation (100 ET) | ||||||
| 98 | 39.3 | 93.7 | 14.98 | 62.6 | 42.0 | 501.5 |
| 150 | 38.8 | 89.9 | 15.55 | 62.4 | 42.1 | 498.0 |
| 200 | 38.5 | 87.5 | 15.75 | 62.3 | 42.9 | 492.5 |
| 250 | 39.5 | 95.8 | 15.65 | 62.3 | 40.9 | 463.5 |
| Pr>F (0.05) - I | 0.0302 | 0.0025 | 0.9621 | 0.0001 | <0.0001 | 0.0254 |
| PrF (0.05) - N | 0.3963 | 0.2948 | 0.0001 | 0.0041 | 0.3817 | 0.0472 |
| Pr>F (0.05) - IxN | 0.6214 | 0.5526 | 0.0662 | 0.3801 | 0.9667 | 0.4698 |
HT: height; YLD: yield; PRO: protein; TWT: test weight; TKW: thousand kernel weight; FN: falling number