Wheat Gross Production Value as Influenced by Yield, Protein and Market
Note: A pdf version of this report can be downloaded by clicking this link.
Title: Winter and Spring Wheat Variety Performance Evaluation Under Northern Montana Conditions on the Basis of Gross Production Value as Influenced by Yield, Protein and Market. 2006-2015.
Principal Investigator: Peggy F. Lamb, Research Scientist, Havre
Project Personnel:
Angela E. Sebelius, Research Associate, Havre
Phil L. Bruckner, Winter Wheat Breeder/Geneticist, Bozeman
Luther E. Talbert, Spring Wheat Breeder/Geneticist, Bozeman
Jim E. Berg, Research Associate, Winter Wheat, Bozeman
Hwa-Young Heo, Research Associate, Spring Wheat, Bozeman
Cooperating County Extension Agents
Cooperating Landowners
Objectives
It is the objective of this project to bring quality and quantity together to allow the forces of market value to influence evaluation of winter and spring wheat varieties under varying cropping conditions in northern Montana.
Results
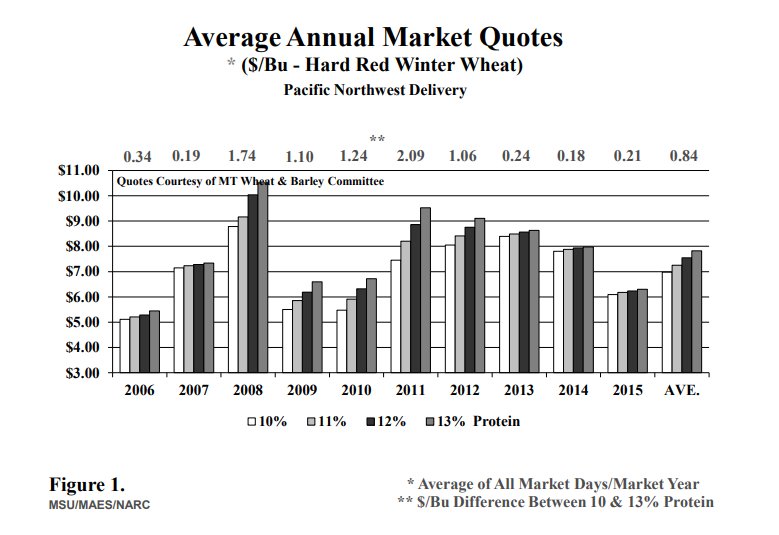
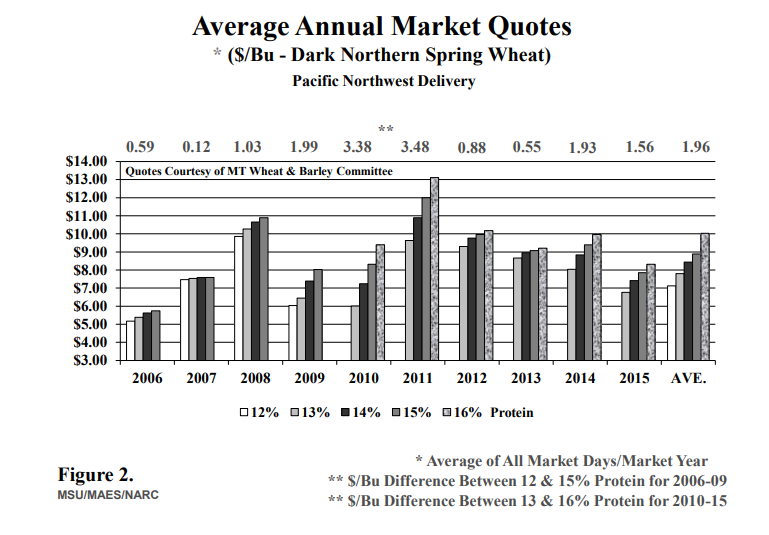
Average annual PNW quotes for Hard Red Winter wheat at 10, 11, 12, and 13 percent protein for the 10-year period 2006-2015 are graphed in Figure 1. The PNW annual market averages for the same period for Dark Northern Spring wheat at 12, 13, 14, 15 and 16 percent protein are graphed in Figure 2. In 2010 bids were no longer available for Dark Northern Spring wheat at 12 percent protein, and bids at 16 percent protein became available. Both graphs include values along the top axis reflecting the average annual dollar per bushel ($/bu) price spread between the minimum and maximum protein levels for which quotes were consistently offered. It should be noted that during 2009 and even more so during 2008, exporters were not issuing bids for certain days (sometimes entire months) and for certain protein levels. Thus, fewer values make up the average annual quotes for those two years, and reported protein levels shifted in 2010 for the Dark Northern Spring. Historical daily bids issued were once available the Montana Wheat and Barley Committee website, however, as of June 30, 2015 Montana Wheat and Barley discontinued reporting the daily market price. Current daily bid data is now accessible at the USDA website: https://www.marketnews.usda.gov/mnp/ls-home
Analyses span the maximum number of calendar years, up to 10, for which data exists for a specific location and variety set. Figures marked with an asterisk (*) denote those for which a reduced number of data years were used in the analyses for purposes of including new or otherwise popular variety releases having fewer data years available. In contrast to the ‘Comparable Average’ method of comparing varietal performance, graphs in this report reflect only analyses where each variety shown was actually grown at that particular location during all years listed. Thus, values included are ‘actual’ in terms of agronomic yield and associated gross return based on protein content and average annual market performance for each year.
It must be kept in mind that in addition to the influence of price variability; crop fertility, plant available water, and numerous other factors can dramatically affect gross dollar return. All trials included were fertilized. No attempt has been made to consider fertilizer or other input costs and their subsequent effect on ‘net’ return because of highly variable and unique producer practices. Plant available water estimates and soil fertility data are available for most of these studies. Climatic and nursery management data details for each off-station trial featured here are included with the associated agronomic evaluations in a separate report. Most Havre data, collected both onstation and off-station, is represented by a minimum ‘applied’ nitrogen rate of 100 lbs actual N/ac since 2012, and 70 lbs actual N/ac in prior years. It should be further understood that management plays a key role in affecting dollar return, be it associated with enhanced product quality, quantity or shrewd marketing skills.
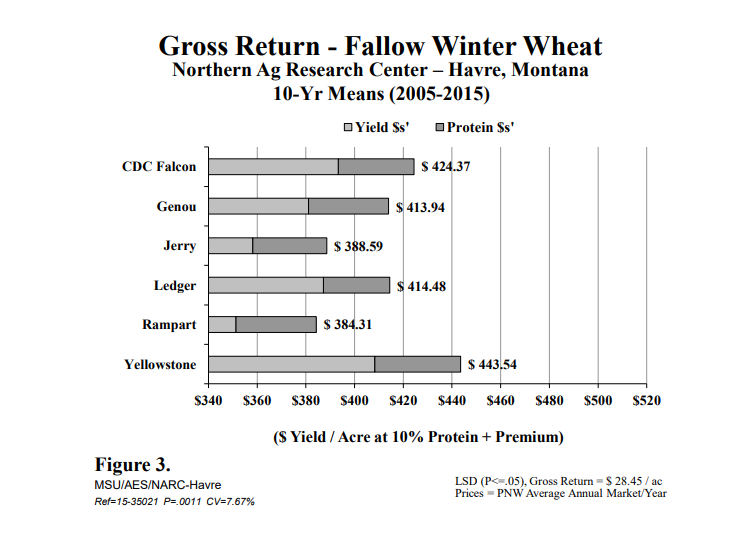
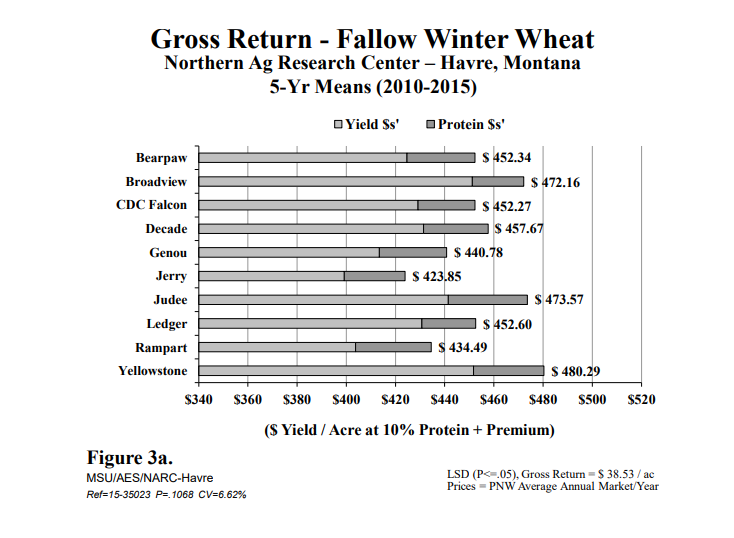
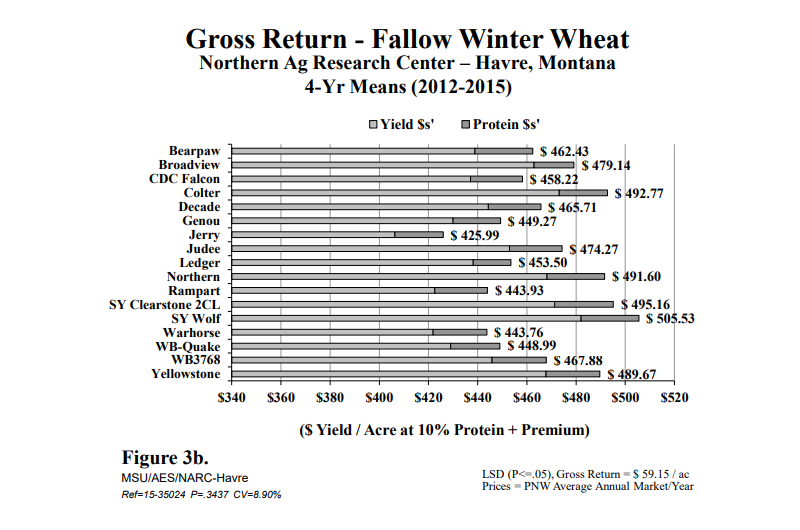
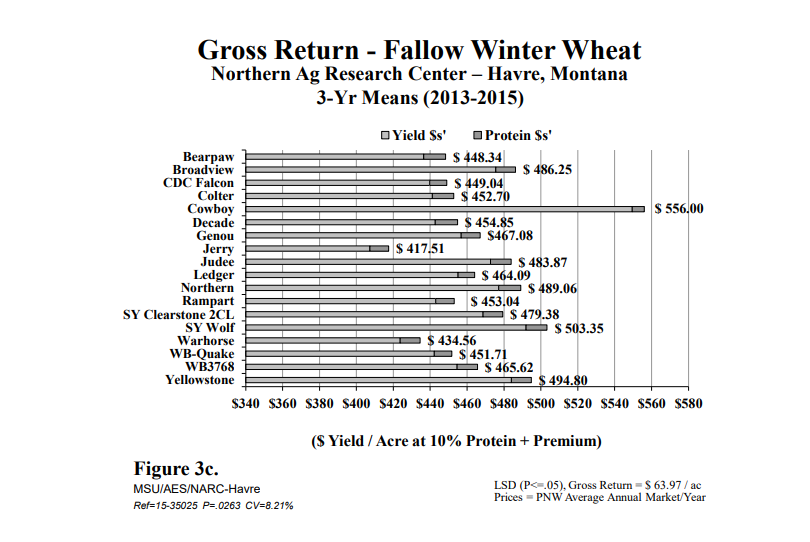
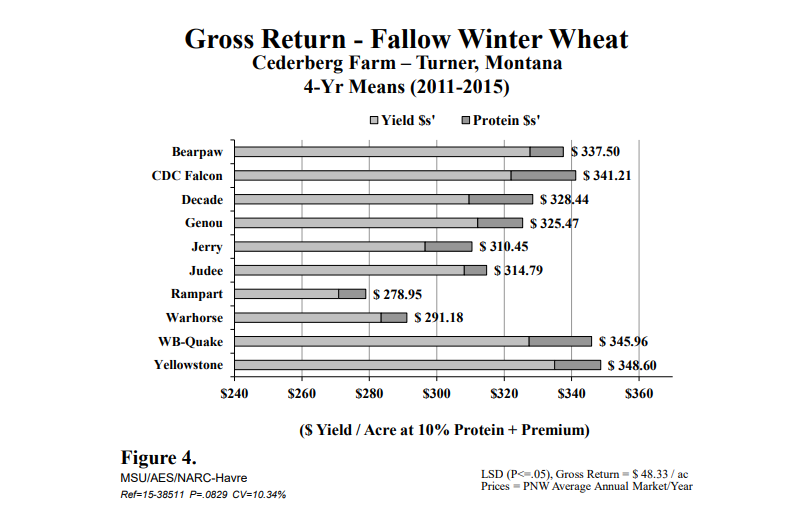
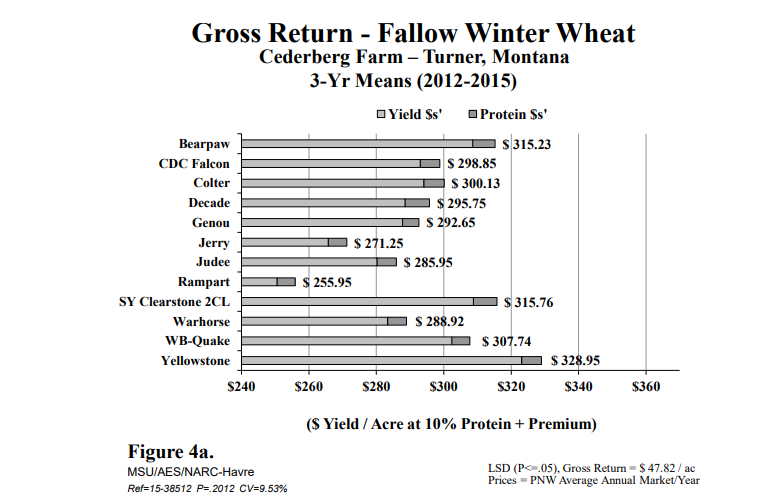
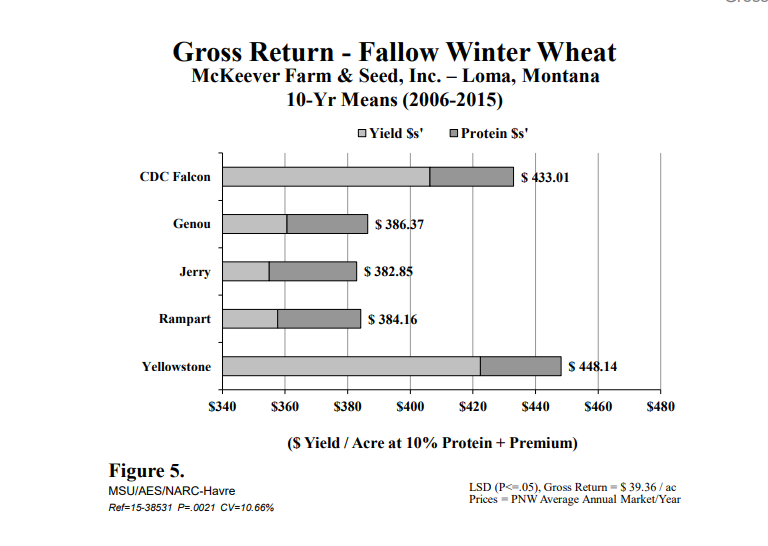
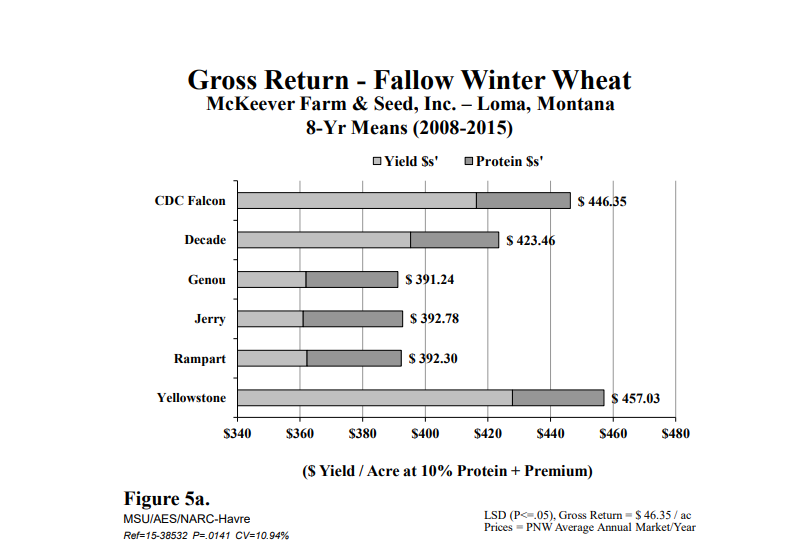
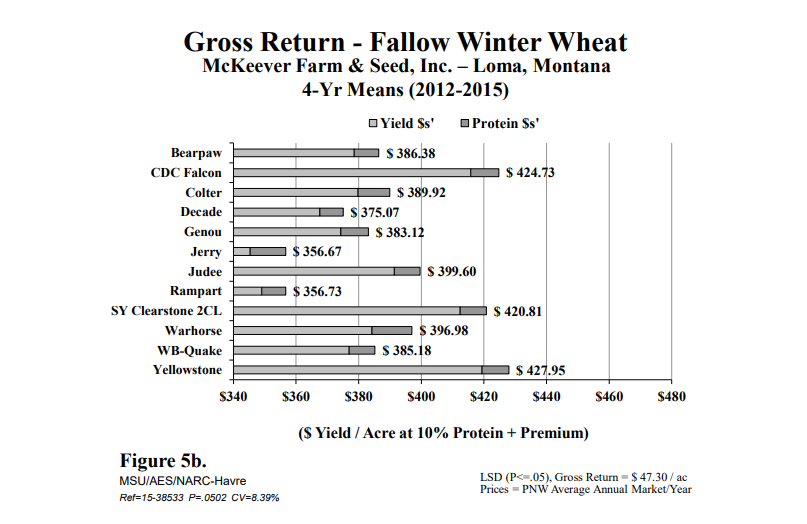
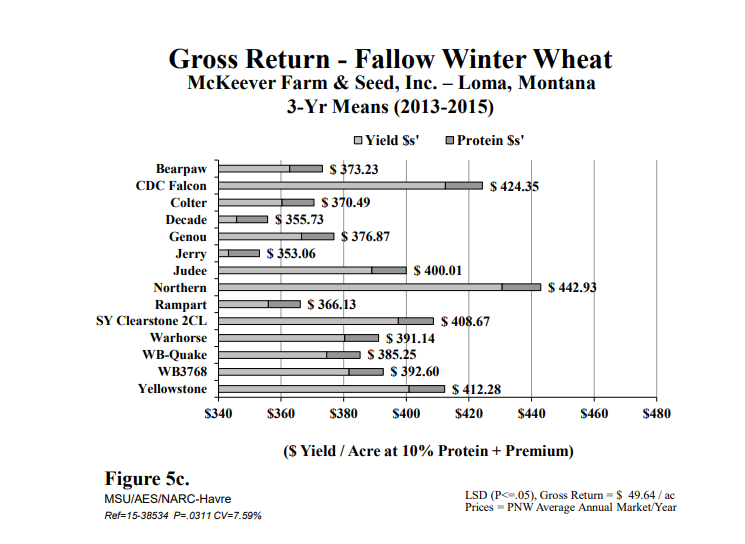
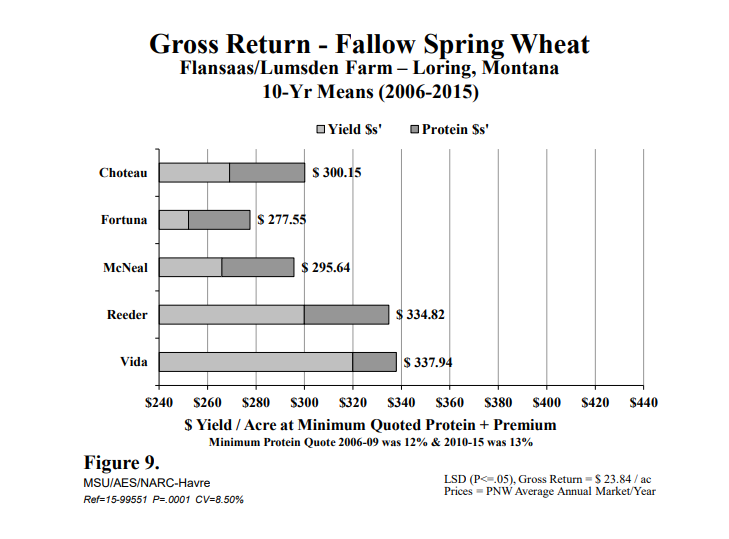
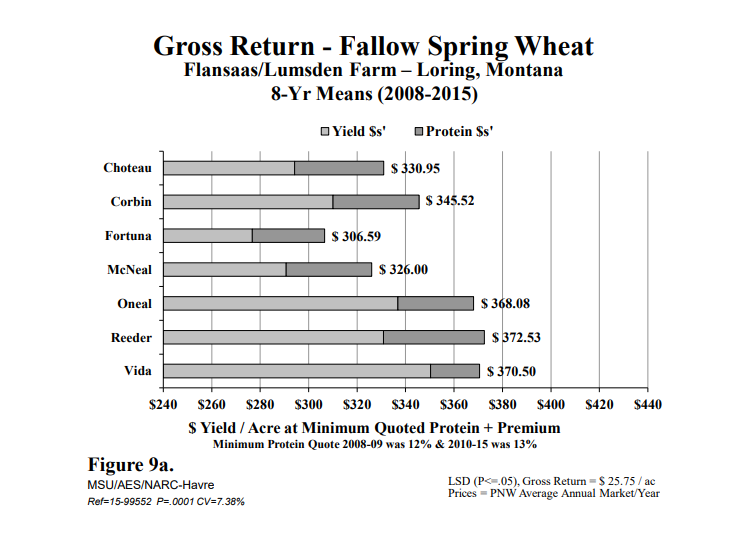
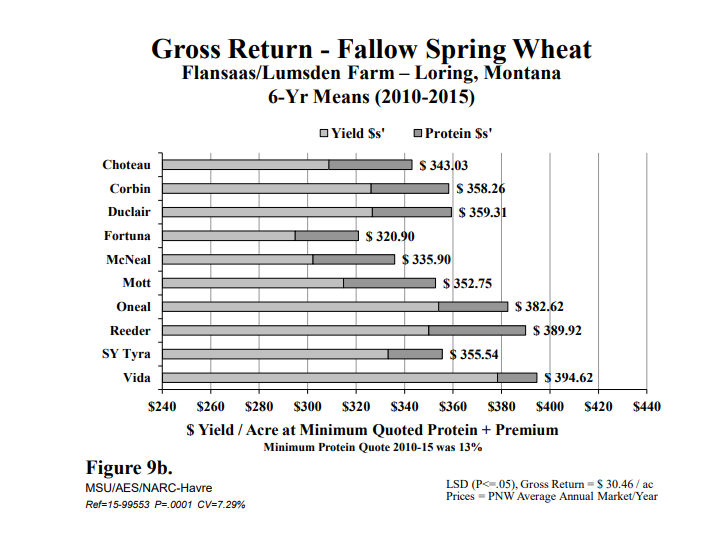
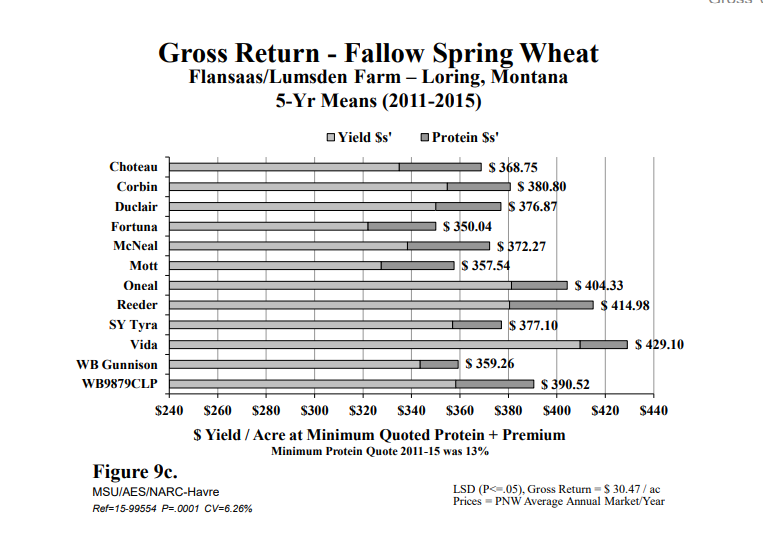
NARC Gross Value 2 ‘Gross Dollar Return’ comparisons are graphically presented in Figures 3 through 9 reflecting research plot response data for the locations and years below:
| Figure # | System & Crop | Location | # Varieties | # Data Yrs. | # Calendar Yrs. | Yrs. Spanned |
| 3 | Flw-WW | NARC | 6 | 10 | 11 | 05-15 |
| *3a | Flw-WW | NARC | 10 | 5 | 6 | 10-15 |
| *3b | Flw-WW | NARC | 17 | 4 | 5 | 11-15 |
| *3c | Flw-WW | NARC | 18 | 3 | 3 | 13-15 |
| *4 | Flw-WW | Turner | 10 | 4 | 5 | 11-15 |
| *4a | Flw-WW | Turner | 12 | 3 | 4 | 12-15 |
| 5 | Flw-WW | Loma | 5 | 10 | 10 | 06-15 |
| *5a | Flw-WW | Loma | 6 | 8 | 8 | 08-15 |
| *5b | Flw-WW | Loma | 12 | 4 | 4 | 12-15 |
| *5c | Flw-WW | Loma | 14 | 3 | 3 | 13-15 |
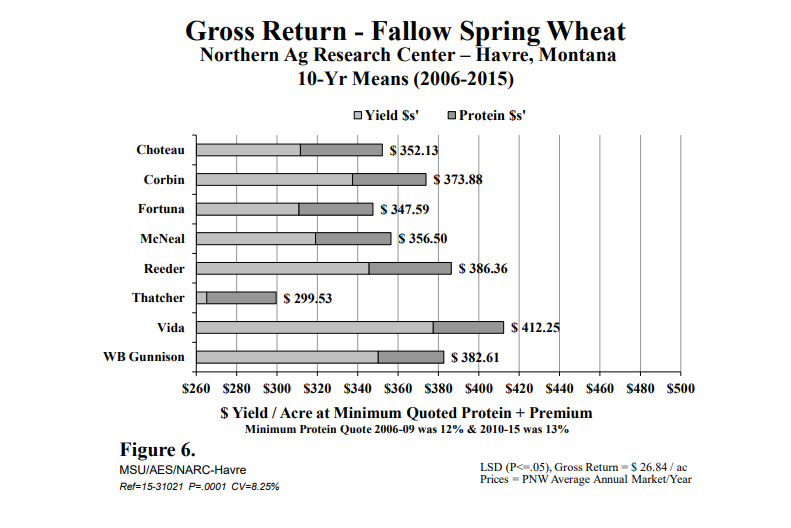
| 6 | Flw-SW | NARC | 8 | 10 | 10 | 06-15 |
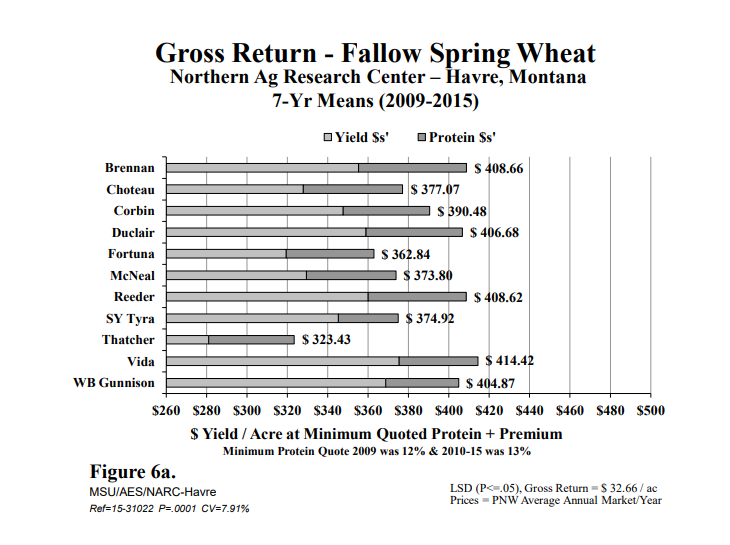
| *6a | Flw-SW | NARC | 11 | 7 | 7 | 09-15 |
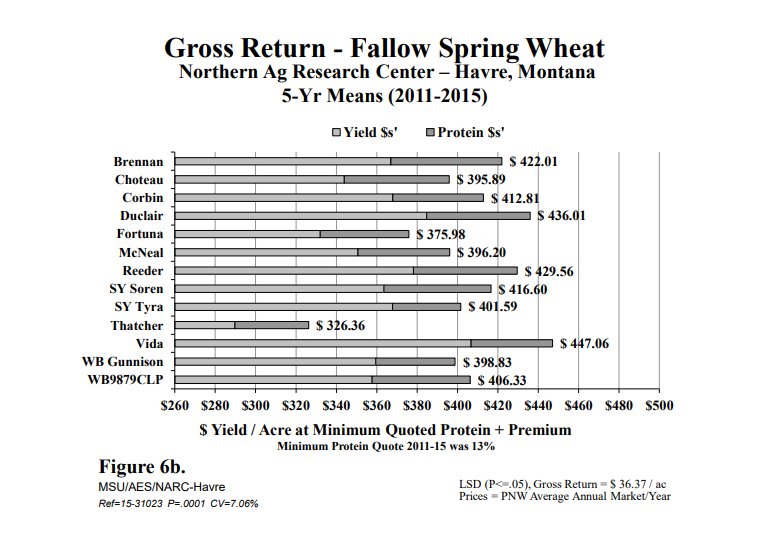
| *6b | Flw-SW | NARC | 13 | 5 | 5 | 11-15 |
| *6c | Flw-SW | NARC | 15 | 3 | 3 | 13-15 |
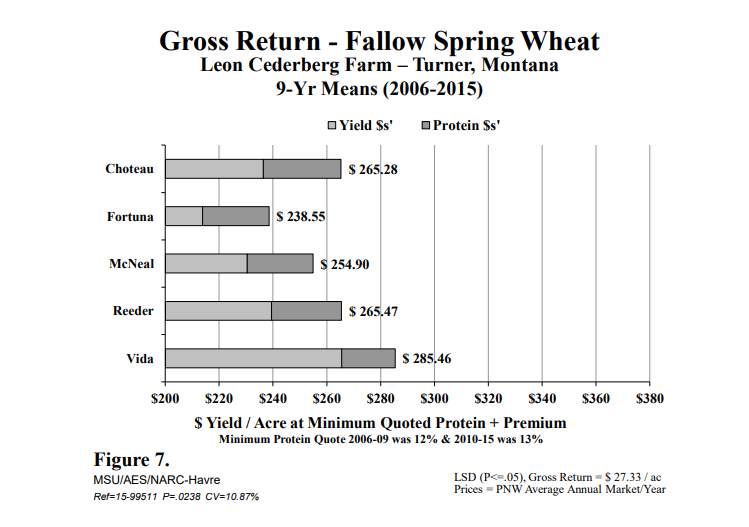
| 7 | Flw-SW | Turner | 5 | 9 | 10 | 06-15 |
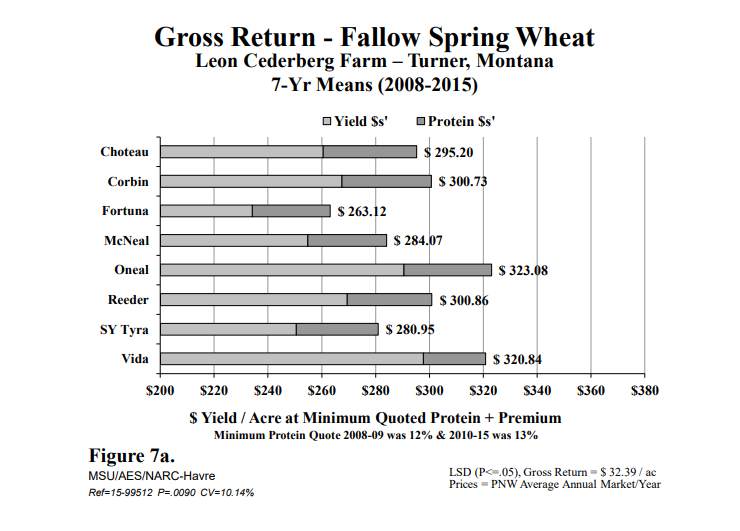
| *7a | Flw-SW | Turner | 8 | 7 | 8 | 08-15 |
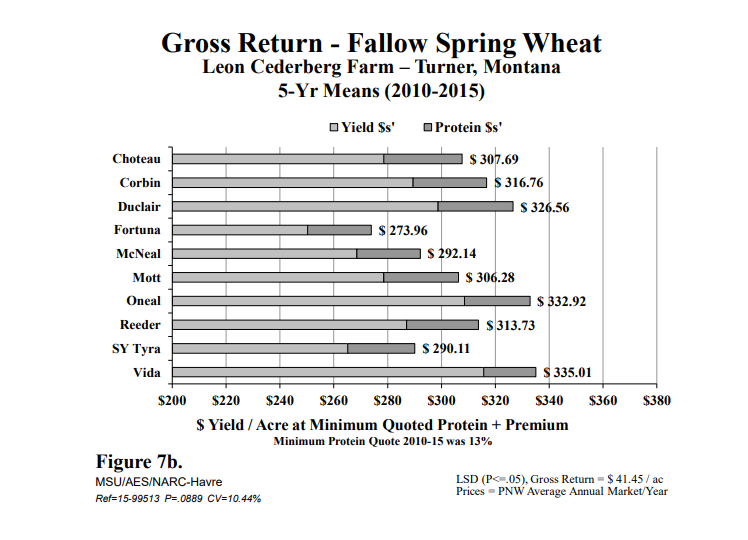
| *7b | Flw-SW | Turner | 10 | 5 | 6 | 10-15 |
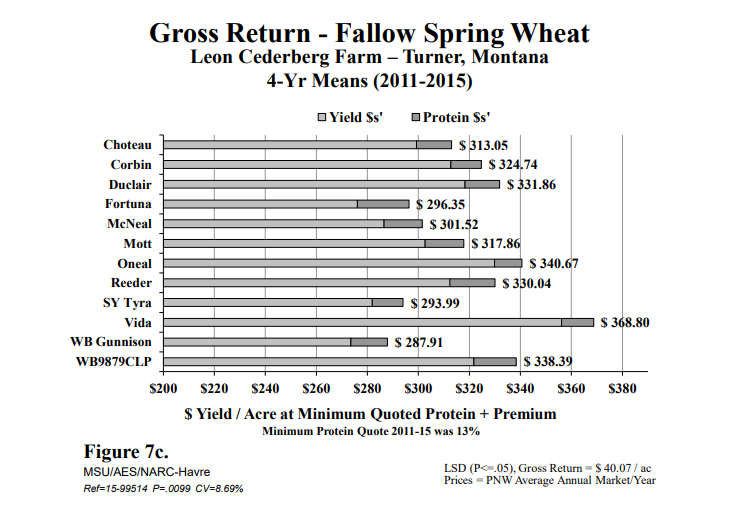
| *7c | Flw-SW | Turner | 12 | 4 | 5 | 11-15 |
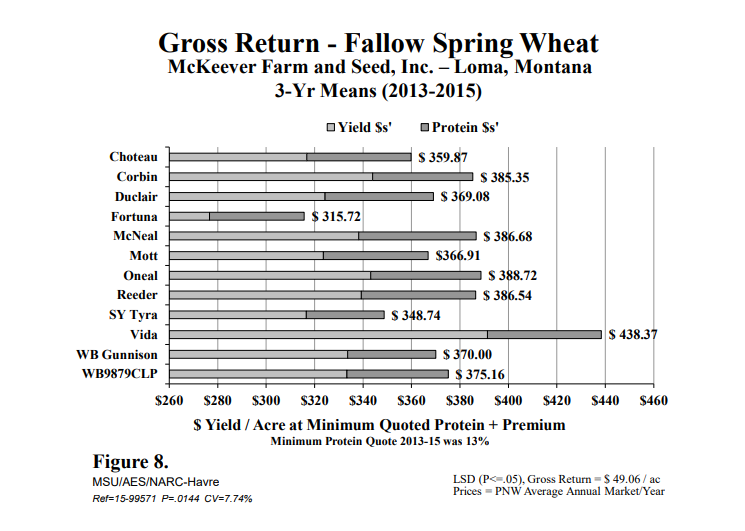
| *8 | Flw-SW | Loma | 12 | 3 | 3 | 13-15 |
| 9 | Flw-SW | Loring | 5 | 10 | 10 | 06-15 |
| *9a | Flw-SW | Loring | 7 | 8 | 8 | 08-15 |
| *9b | Flw-SW | Loring | 10 | 6 | 6 | 10-15 |
| *9c | Flw-SW | Loring | 12 | 5 | 5 | 11-15 |
Summary
Producers are well aware of the impact protein premiums can have on overall market value, but are troubled by the fact that the market has generally not been consistent in terms of rewarding growers for producing high quality wheat. The potential for discount associated with low quality has likely had more bearing on production management than have positive incentives in the form of premiums for quality above average. In the past decade, average annual premiums for 10-13 percent protein winter wheat and 13-16 percent protein spring wheat have varied from as little as $0.06 to as much as $1.16 per point increase in protein per bushel. Producers have encouraged researchers to evaluate potential new practices in terms of dollars and cents. Such is never easy; and this particular effort toward quantifying wheat variety performance on the basis of total dollar return was no exception.
For each research location, a multi-year, average gross market value per acre was determined for selected varieties. Such values were based on gross return for actual yield at the lowest consistently quoted protein level plus added gross return for protein premium, if any. The sum of the two values then represents the gross return per acre in a given market year. Calculations were made for each year the varieties were under evaluation at a particular location. The values were then tested via analysis of variance with data years as replications.
It should be noted that the current procedure affords no mechanism for appropriate adjustment of gross return where protein content is either below that termed as "minimum quoted" (10 percent for winter wheat and 13 percent for spring wheat), or above that termed as "maximum quoted" (13 percent for winter wheat and 16 percent for spring wheat). Thus, discounts for protein below the minimum quoted, or added premiums sometimes available for protein above normal quote maximums, cannot be reflected in these data. Due to fertilization, situations where protein levels were below minimum are rare in these research databases. However, situations where protein exceeded the maximum level for which market quotes were available may be common in years of low yield associated with drought stress. Thus, in cases where proteins for ‘average protein performing’ varieties in a particular trial are at the maximum level for which a market quote exists; entries with higher protein are not benefited by additional premium as they may have been in a commercial marketing situation.
One must also remain aware that the marketing periods chosen for these analyses can have pronounced effects on the results due to obvious year differences in overall market price and premium spreads. Not unlike most crop evaluation procedures, but perhaps even more important in this case, data reliability increases with additional years of observation. At present, it would appear that a minimum of four to five years should be involved for meaningful comparison via this system, however in specific instances; three year analyses have been included to elucidate the potential of promising newly released varieties. For this 2015 report, all analyses include a minimum of three years of data.
Recognition: This research would not have been possible without the assistance of the following temporary hourly employees: Nathan Chapman, Kasee Clark, Rocky Kuhr, Derek Matosich, Kyla McNamara, Dakota Parsons & Kathy Wesley.