
Nitrogen Use Response of Irrigated and Dryland Spring Wheat
Project Leader:
Jessica Torrion (PI), Bob Stougaard (Co-PI)
Project Personnel:
John Garner, Brooke Bohannon
Link to Nitrogen Use Response of Irrigated and Dryland Spring Wheat Printable PDF
Objective:
To evaluate variety-specific nitrogen use response of irrigated spring wheat for agronomic performance.
Summary:
Eight spring wheat cultivars were grown under four different nitrogen levels as a split plot, randomized complete block design, with four replications, where nitrogen levels represent the whole plot factor and the spring wheat varieties were the sub plot factor. The four nitrogen treatments included no added fertilizer and 150, 281, and 412 pounds/A, respectively, based on soil test N levels plus supplemental N fertilization. For the irrigated study, irrigation was applied when necessary to keep soil moisture from falling below 50% of the plant available water. Other agronomic management procedures are detailed in Table 1.
Table 1. Agronomic Data |
|||
|---|---|---|---|
| Seeding Date: | 4/22/2015 | Herbicide | 5/20/2015 |
| Julian Date: | 112 | 13.7 fl oz/A Huskie complete + 0.5 lb/A AMS | |
| Seeding Rate: | 20 plnts/sqft | Pesticide: | 6/19/2015 |
| Previous Crop | Canola | 12 fl oz/A Quadris + 1.92 fl oz/A Warrior II | |
| Tillage: | Conventional | Harvest Date: | 8/5/2015 (Dryland) |
| Soil Type: | Fine Sandy Loam | Julian Date: | 217 |
| Soil Test: | 19-6-111 | Harvest Date: | 8/12/2015 |
| Fertilizer: | __-48-115 | Julian Date: | 224 |
Irrigated
Nitrogen treatment had significant effect on physiological maturity, moisture content, yield, protein, and test weight (Table 2). Volt had the highest yield at 106.3 bu/A with 281 lbs N, while Cabernet had the least yield at 57.8 bu/A with 412 lbs N. The 150 lbs/A total N consistently showed yield response across varieties. Except for Volt and McNeal, the 281 lbs N/A reduced yield. The highest N at 412 lbs/A significantly reduced yields (Figure 2).
The known inverse relationship between yield and protein is evident (Figure 1 and 2). Increased N supply consistently increased protein across varieties with irrigation. For irrigated spring wheat, test weights has inverse relation with N supply. The lower the N supply the higher the test weight, as N supply increased, test weight decreased (Figure 3). Increased N beyond 150 lbs/A is not economically justifiable with this year’s protein premium/discount. Plant height, seed size, thousand kernel weight and falling number were not influenced by the N treatment, but appeared strongly related to variety.
Table 2. Effect of N levels to agronomic performance of irrigated spring wheat |
|||||||||
|---|---|---|---|---|---|---|---|---|---|
| Variety | HT | PM* | SS | MC | YLD | PRO | TWT | TKW | FN |
| in | days | seeds/lb | % | bu/A | % | lb/bu | g | sec | |
| 19 lbs N (no added fertilizer) | |||||||||
| Brennan | 22.5 | 83 | 12484 | 4.4 | 64.8 | 14.4 | 63.4 | 36.4 | 424.0 |
| Buck Pronto | 26.5 | 82 | 10483 | 5.1 | 75.8 | 13.0 | 63.2 | 43.4 | 370.0 |
| Cabernet | 22.5 | 83 | 11525 | 5.3 | 79.5 | 12.2 | 63.6 | 39.5 | 317.0 |
| Expresso | 25.8 | 84 | 11270 | 5.1 | 75.2 | 13.8 | 63.2 | 40.3 | 303.0 |
| McNeal | 27.5 | 83 | 10863 | 5.3 | 78.5 | 11.8 | 62.6 | 41.9 | 508.0 |
| Solano | 22.5 | 84 | 10537 | 5.5 | 81.8 | 13.2 | 63.7 | 43.2 | 360.0 |
| Volt | 28.3 | 85 | 12015 | 5.9 | 87.6 | 12.0 | 64.4 | 37.9 | 390.0 |
| WB Rockland | 23.3 | 84 | 10468 | 4.6 | 68.3 | 14.6 | 62.8 | 43.4 | 307.0 |
| 150 lb N (soil + fertilizer) | |||||||||
| Brennan | 22.3 | 86 | 12059 | 5.3 | 78.5 | 15.0 | 63.4 | 63.4 | 398.0 |
| Buck Pronto | 26.5 | 85 | 10352 | 6.2 | 91.9 | 13.8 | 62.7 | 62.7 | 375.0 |
| Cabernet | 22.0 | 84 | 11521 | 6.0 | 88.5 | 12.6 | 63.6 | 63.6 | 316.0 |
| Expresso | 27.5 | 86 | 10879 | 7.0 | 104.4 | 13.9 | 62.5 | 62.5 | 306.0 |
| McNeal | 29.5 | 86 | 10796 | 6.8 | 101.8 | 13.2 | 62.5 | 62.5 | 457.0 |
| Solano | 25.3 | 86 | 10679 | 6.7 | 99.1 | 13.9 | 63.0 | 63.0 | 350.0 |
| Volt | 28.0 | 86 | 12150 | 6.8 | 101.2 | 12.7 | 64.0 | 64.0 | 369.0 |
| WB Rockland | 24.5 | 86 | 10357 | 6.3 | 93.4 | 15.0 | 62.3 | 62.3 | 341.0 |
| 281 lb N (soil + fertilizer) | |||||||||
| Brennan | 23.0 | 85 | 12025 | 4.9 | 72.2 | 16.0 | 62.2 | 62.2 | 383.0 |
| Buck Pronto | 26.8 | 85 | 9828 | 5.9 | 87.3 | 15.1 | 60.9 | 60.9 | 360.0 |
| Cabernet | 21.8 | 85 | 11415 | 5.7 | 85.2 | 13.9 | 62.5 | 62.5 | 319.0 |
| Expresso | 26.3 | 87 | 10931 | 6.9 | 102.3 | 15.0 | 60.7 | 60.7 | 301.0 |
| McNeal | 32.0 | 87 | 10387 | 6.9 | 102.8 | 14.2 | 60.5 | 60.5 | 461.0 |
| Solano | 25.5 | 87 | 10573 | 6.6 | 98.3 | 14.8 | 61.1 | 61.1 | 358.0 |
| Volt | 28.3 | 87 | 11780 | 7.2 | 106.3 | 13.8 | 62.4 | 62.4 | 366.0 |
| WB Rockland | 24.0 | 87 | 10213 | 6.2 | 92.2 | 16.1 | 60.1 | 60.1 | 328.0 |
| 412 lb N (soil + fertilizer) | |||||||||
| Brennan | 23.8 | 86 | 12113 | 4.2 | 62.4 | 16.3 | 61.4 | 37.5 | 409.0 |
| Buck Pronto | 26.0 | 84 | 10113 | 5.4 | 80.3 | 14.9 | 60.3 | 44.9 | 367.0 |
| Cabernet | 23.0 | 86 | 11384 | 3.9 | 57.8 | 14.2 | 61.8 | 40.0 | 331.0 |
| Expresso | 24.8 | 86 | 11081 | 5.7 | 84.4 | 15.3 | 59.9 | 41.0 | 295.0 |
| McNeal | 27.8 | 87 | 10246 | 6.4 | 94.2 | 14.6 | 60.1 | 44.3 | 461.0 |
| Solano | 24.8 | 86 | 10706 | 5.8 | 86.7 | 15.2 | 61.1 | 42.4 | 342.0 |
| Volt | 26.0 | 86 | 11926 | 6.4 | 95.3 | 14.1 | 62.8 | 38.1 | 361.0 |
| WB Rockland | 24.8 | 87 | 10149 | 5.3 | 79.1 | 16.7 | 59.8 | 44.7 | 315.0 |
| CV | 12.3 | 2.2 | 8.0 | 16.1 | 17.0 | 9.6 | 2.7 | 7.8 | 15.2 |
| LSD | ns | 1.8 | ns | 0.8 | 11.8 | 0.8 | 2.0 | ns | ns |
| Pr>F(0.05)-N | 0.107 | 0.003 | 0.088 | 0.002 | 0.002 | <.0001 | 0.009 | 0.105 | 0.291 |
| Pr>F(0.05)-Var | <.0001 | <.0001 | <.0001 | <.0001 | <.0001 | <.0001 | <.0001 | <.0001 | <.0001 |
| Pr>F(0.05)-NxVar | 0.168 | 0.936 | 0.801 | 0.121 | 0.127 | 0.134 | 0.843 | 0.607 | 0.002 |
| HT: height, PM: physiological maturity *(duration from emergence), SS: seed size, MC: moisture content, YLD: yield, PRO:protein, TWT: test weight, TKW: thousand kernel weight, FN: falling number, ns: nonsignificant | |||||||||
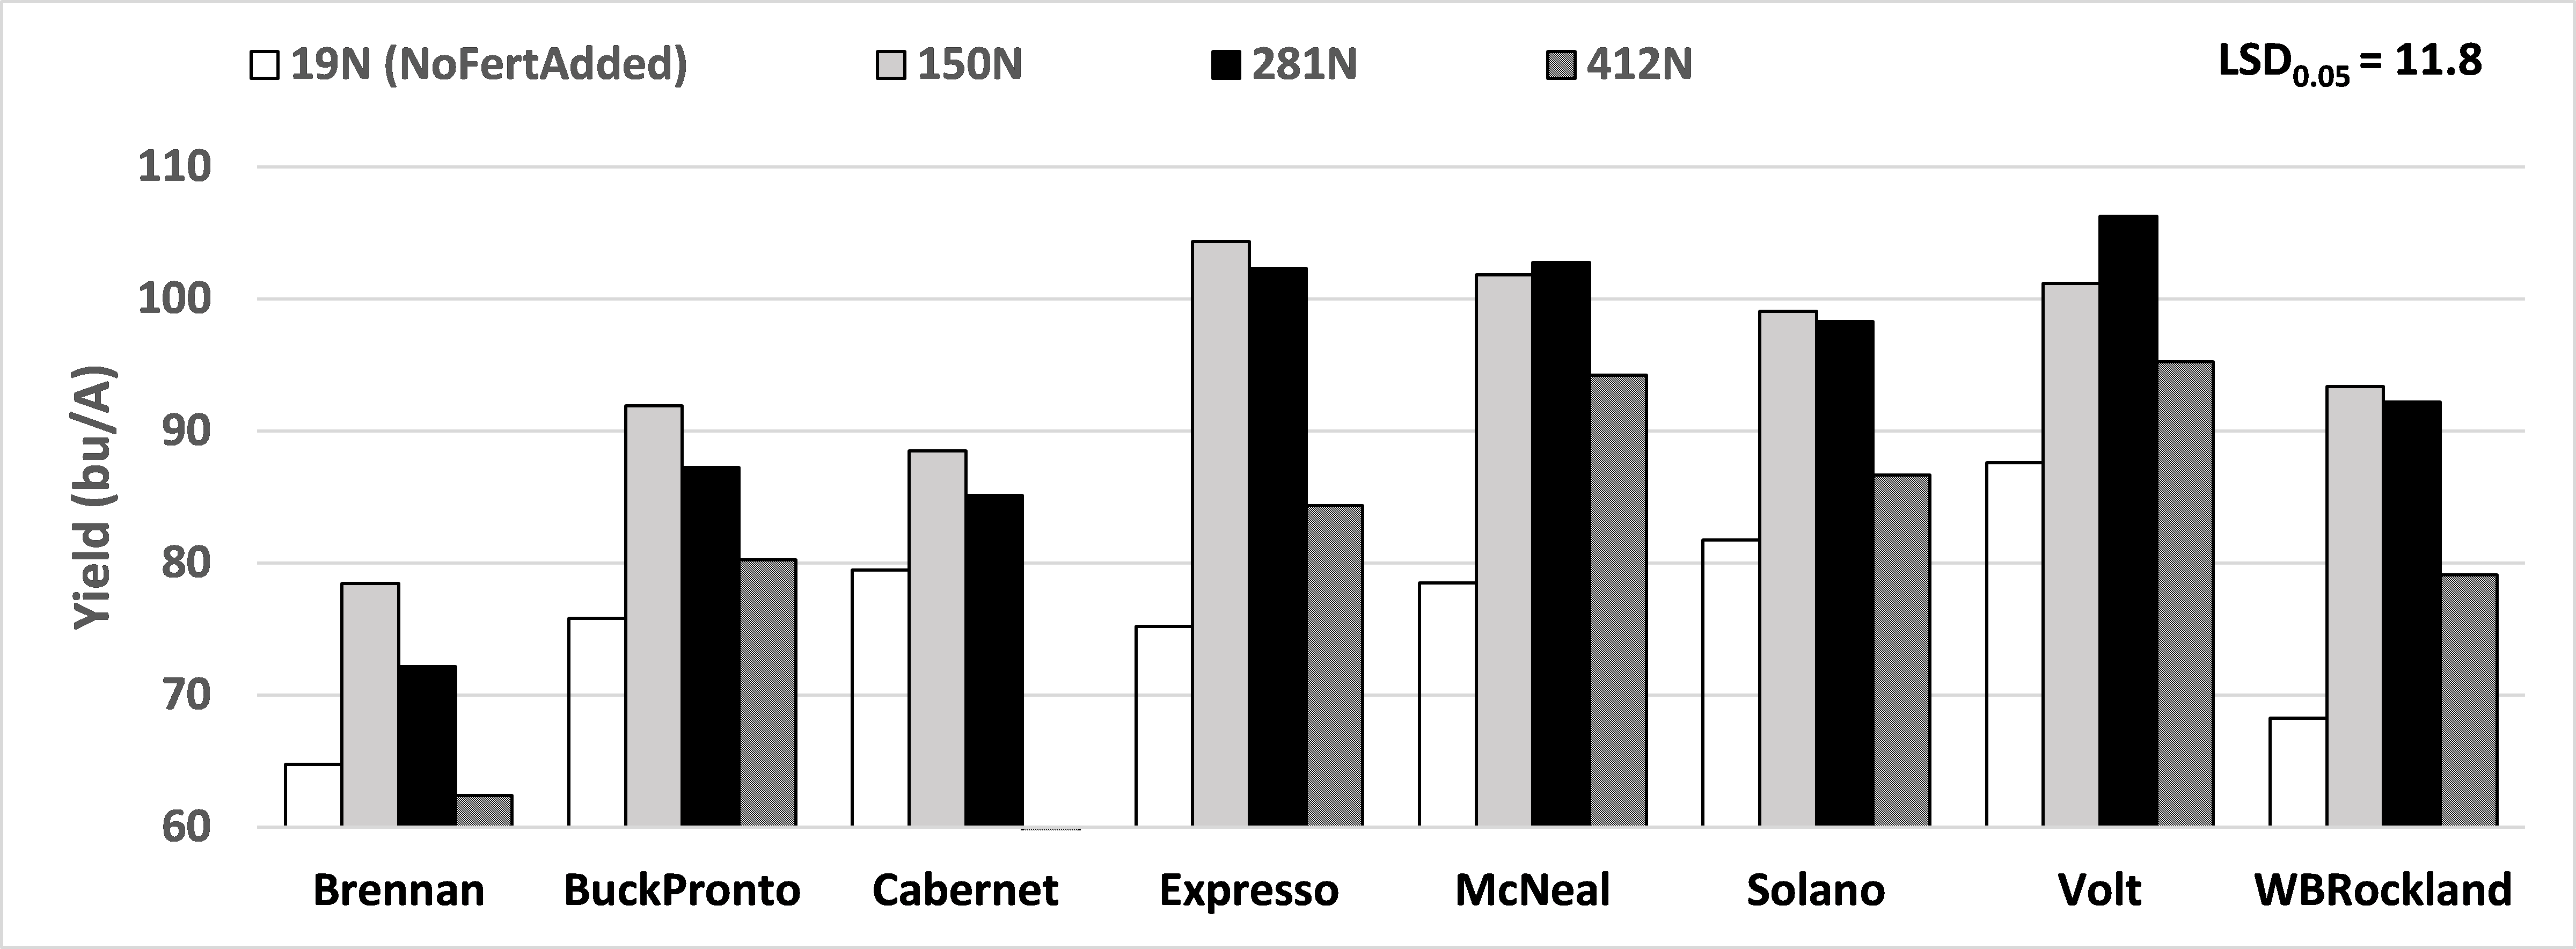
Figure 1. Yield response to N levels of an irrigated spring wheat on fine sandy loam soil
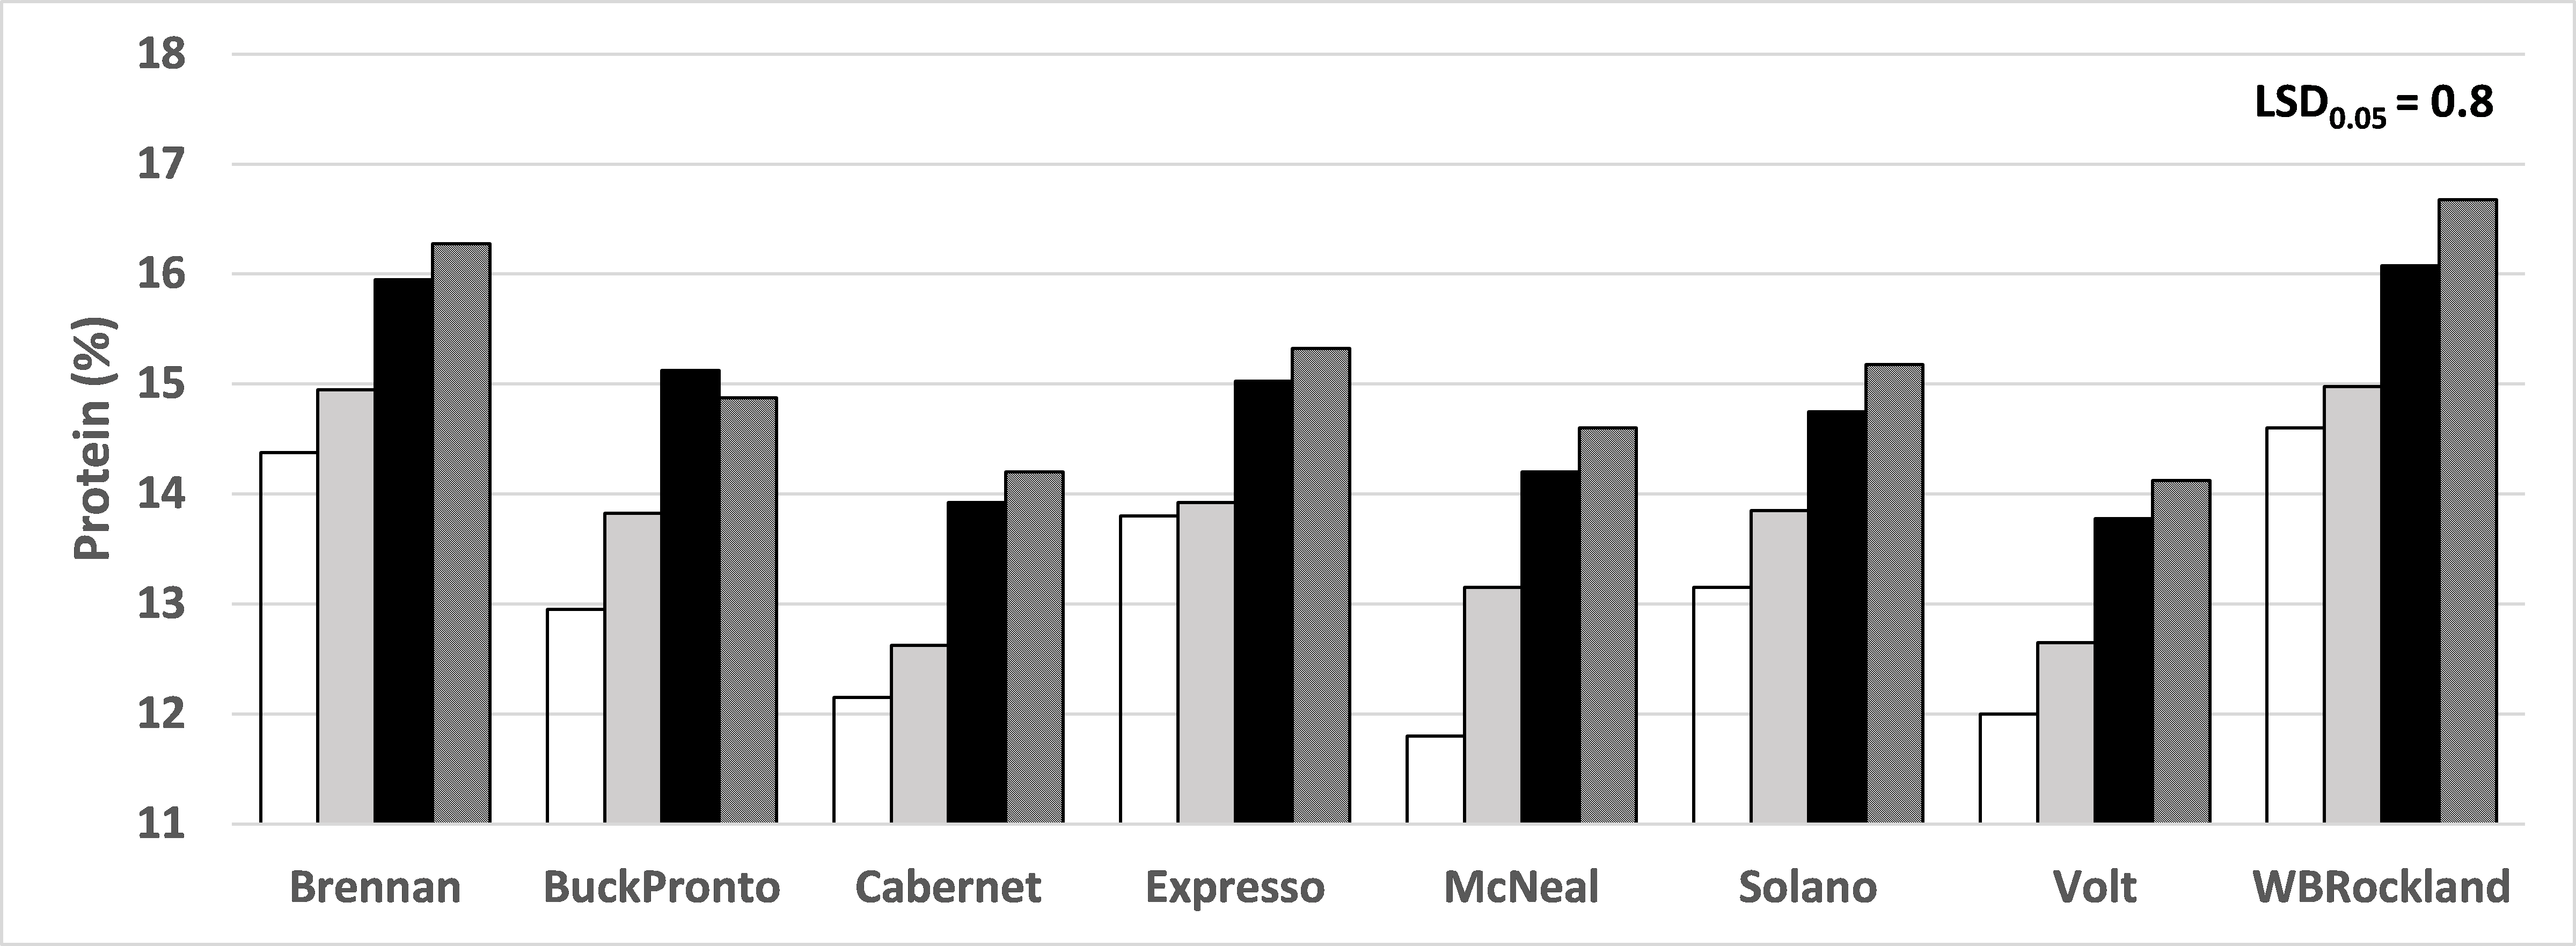
Figure 2. Protein response to N levels of an irrigated spring wheat, fine sandy loam soil
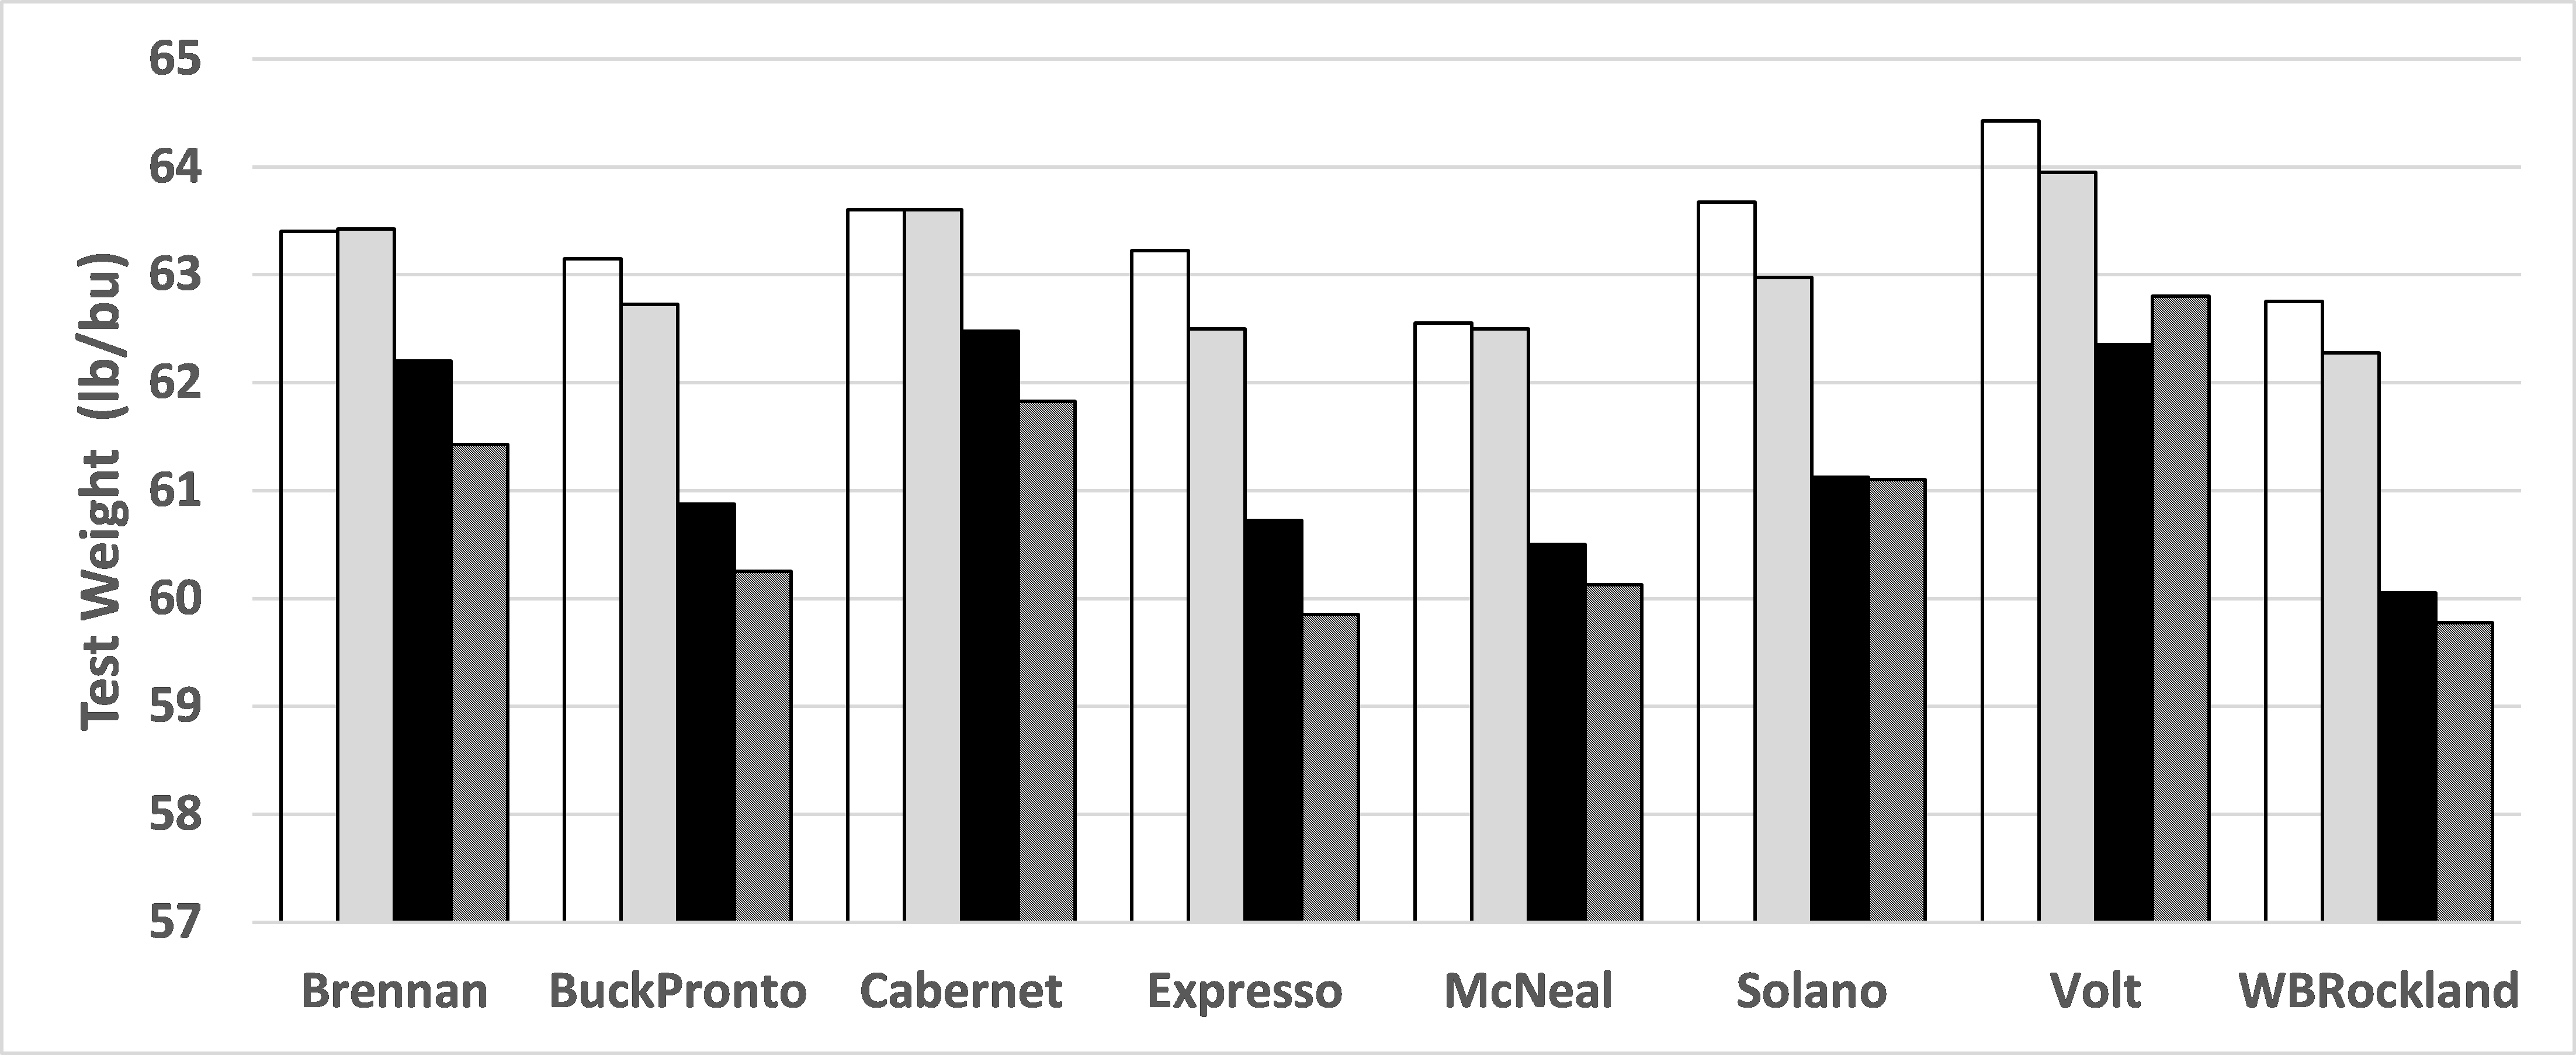
Figure 3. Test weight response to N levels of an irrigated spring wheat, fine sandy loam soil
Dryland
No yield response for N application was observed due to extreme drought year. Volt had the highest yield and Brennan had the least. Nitrogen treatment had significant effect on increased protein up to 150 lbs N/A (Table 3). Despite protein advantage at 150 lbs N/A, application of N during such dry season on fine sandy loam soil with only 4.7 inches plant available water (PAW) cannot be justified (root zone 50% PAW at planting + rainfall, see Figure 5).
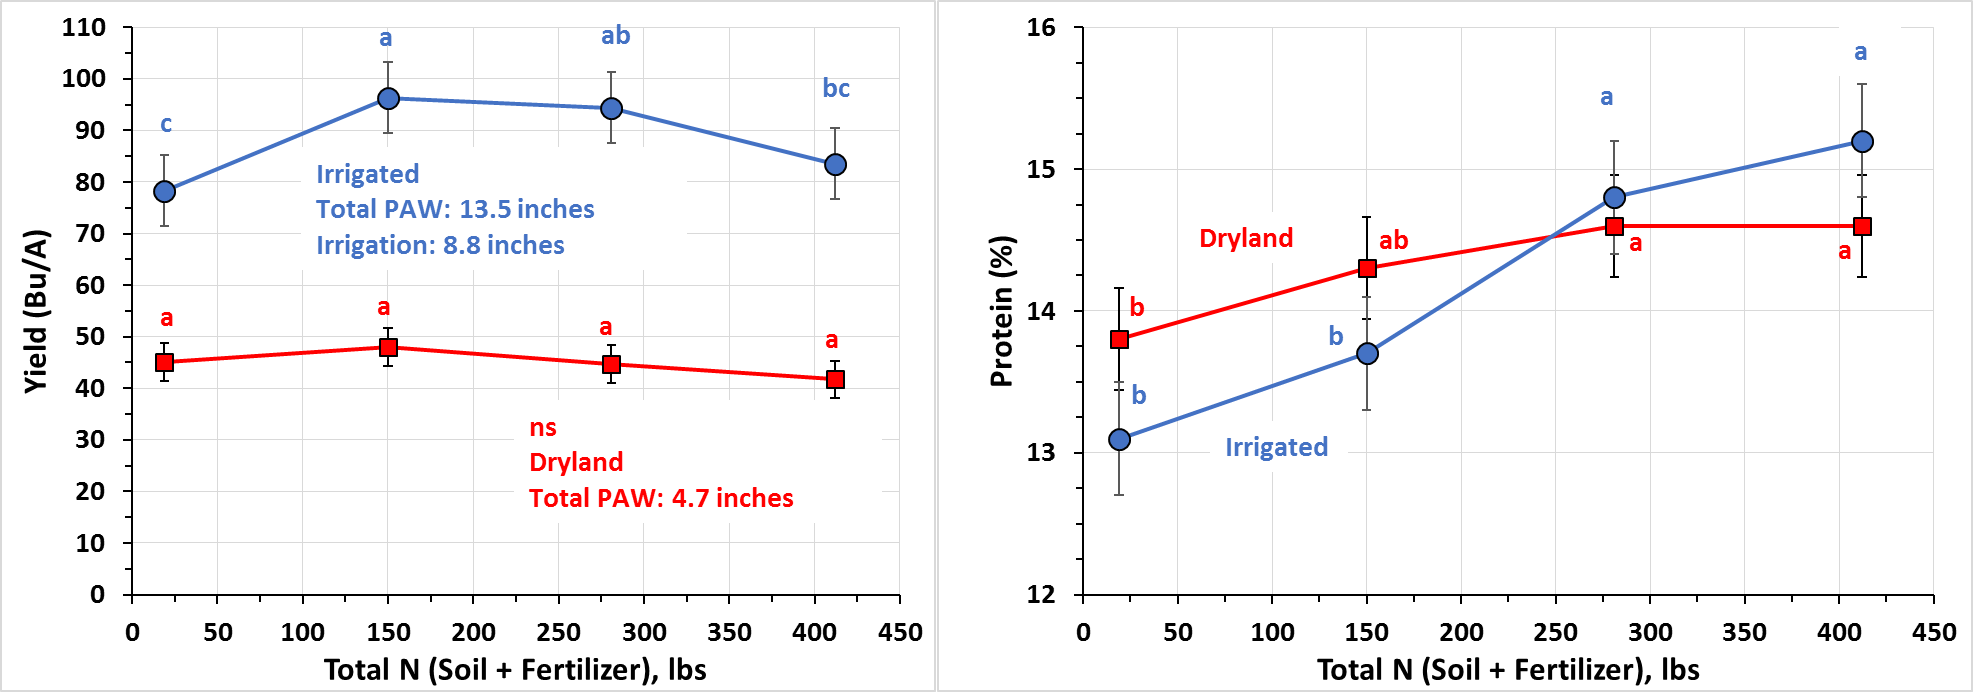
Figure 4. Spring wheat yield response to total N supply per water regime (left) and their corresponding protein quality (right). Same letter assignment indicates that they are not significantly different.
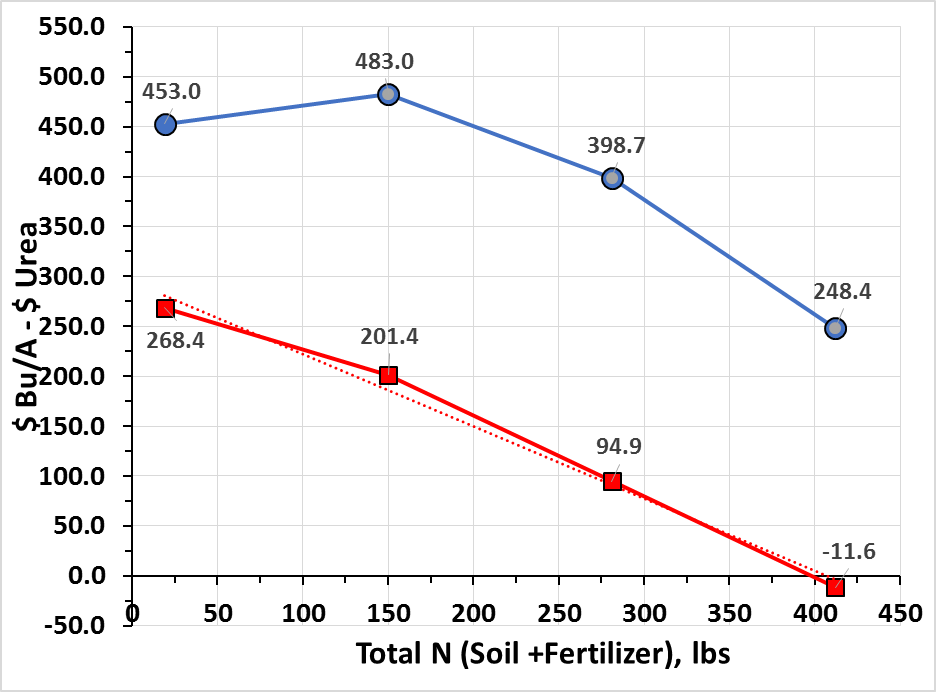
Figure 5. Adjusted gross return of N application for two water regimes
For irrigated spring wheat in 2015, adjusted gross returns diminished with N application resulting to more than 150 lbs total N. For dryland spring, N application did not provide any economic advantage (Figure 5) despite the increased protein with N supply (Figure 4, right). Thus, for extreme drought like this year, reduction of N input should be considered.
Table 3. Effect of N levels to agronomic performance of dryland spring wheat |
|||||||||
|---|---|---|---|---|---|---|---|---|---|
| Variety | HT | PM* | SS | MC | YLD | PRO | TWT | TKW | FN |
| in | days | seeds/lb | % | bu/A | % | lb/bu | g | sec | |
| 19 lbs N (no added fertilizer) | |||||||||
| Brennan | 19.9 | 76 | 14800 | 9.5 | 40.7 | 14.1 | 62.5 | 30.9 | 459 |
| Buck Pronto | 22.2 | 77 | 13103 | 9.6 | 44.6 | 13.7 | 61.5 | 34.8 | 420 |
| Cabernet | 17.6 | 76 | 14134 | 10.0 | 43.9 | 13.3 | 62.2 | 32.4 | 343 |
| Expresso | 22.0 | 78 | 13250 | 11.0 | 47.5 | 14.3 | 61.6 | 34.3 | 307 |
| McNeal | 23.8 | 77 | 14031 | 10.3 | 45.2 | 13.0 | 60.8 | 32.4 | 537 |
| Solano | 21.8 | 77 | 12524 | 10.3 | 49.4 | 13.9 | 62.2 | 36.3 | 390 |
| Volt | 23.0 | 78 | 14717 | 11.5 | 49.9 | 12.7 | 62.8 | 30.9 | 418 |
| WB Rockland | 19.6 | 79 | 12311 | 10.6 | 39.8 | 15.0 | 61.5 | 36.9 | 315 |
| 150 lb N (soil + fertilizer) | |||||||||
| Brennan | 19.9 | 76 | 15644 | 9.4 | 41.9 | 14.5 | 62.3 | 29.0 | 455 |
| Buck Pronto | 22.1 | 76 | 13458 | 9.5 | 46.1 | 14.2 | 61.1 | 33.8 | 407 |
| Cabernet | 17.3 | 76 | 14841 | 9.5 | 42.6 | 13.8 | 61.6 | 30.6 | 348 |
| Expresso | 22.4 | 79 | 13283 | 10.2 | 52.8 | 15.1 | 62.0 | 34.2 | 322 |
| McNeal | 23.3 | 78 | 13821 | 9.9 | 49.4 | 13.7 | 60.7 | 32.8 | 507 |
| Solano | 21.2 | 77 | 12375 | 10.0 | 51.4 | 14.7 | 61.8 | 36.6 | 388 |
| Volt | 23.5 | 78 | 14128 | 9.9 | 53.9 | 13.0 | 63.6 | 32.6 | 433 |
| WB Rockland | 20.9 | 78 | 12481 | 9.8 | 45.7 | 15.5 | 61.7 | 36.4 | 341 |
| 281 lb N (soil + fertilizer) | |||||||||
| Brennan | 19.9 | 76 | 15313 | 10.1 | 37.7 | 15.0 | 61.9 | 29.7 | 424 |
| Buck Pronto | 21.9 | 76 | 12776 | 10.0 | 42.8 | 14.6 | 60.9 | 35.6 | 411 |
| Cabernet | 17.5 | 77 | 13493 | 10.6 | 40.2 | 14.1 | 61.6 | 33.9 | 338 |
| Expresso | 21.9 | 78 | 12864 | 11.4 | 48.0 | 15.1 | 61.2 | 35.4 | 301 |
| McNeal | 24.6 | 77 | 13728 | 11.8 | 46.4 | 14.1 | 59.9 | 33.1 | 507 |
| Solano | 20.8 | 79 | 12272 | 11.4 | 43.3 | 14.8 | 61.5 | 37.1 | 360 |
| Volt | 23.1 | 79 | 14320 | 12.0 | 55.9 | 13.3 | 62.5 | 31.7 | 388 |
| WB Rockland | 21.0 | 79 | 12042 | 11.1 | 43.5 | 15.8 | 61.2 | 37.8 | 314 |
| 412 lb N (soil + fertilizer) | |||||||||
| Brennan | 20.3 | 77 | 15098 | 9.8 | 35.8 | 15.1 | 62.0 | 30.1 | 415 |
| Buck Pronto | 23.0 | 76 | 12781 | 9.9 | 40.7 | 14.7 | 61.0 | 35.5 | 397 |
| Cabernet | 17.8 | 76 | 14032 | 10.1 | 37.5 | 14.0 | 61.8 | 32.4 | 326 |
| Expresso | 23.0 | 79 | 13032 | 12.1 | 44.0 | 15.4 | 60.5 | 34.8 | 276 |
| McNeal | 23.9 | 78 | 13280 | 11.7 | 45.5 | 14.3 | 60.5 | 34.2 | 523 |
| Solano | 21.0 | 78 | 12533 | 11.1 | 45.3 | 14.9 | 61.5 | 36.2 | 352 |
| Volt | 23.6 | 79 | 14635 | 10.8 | 47.4 | 13.3 | 63.0 | 31.0 | 404 |
| WB Rockland | 20.8 | 78 | 11963 | 12.4 | 37.3 | 15.1 | 60.7 | 38.0 | 301 |
| CV | 10.5 | 1.8 | 8.9 | 12.6 | 15.5 | 6.4 | 1.6 | 8.9 | 18.3 |
| LSD | ns | ns | ns | ns | ns | 0.6 | ns | ns | ns |
| Pr>F(0.05)-N | 0.699 | 0.450 | 0.259 | 0.275 | 0.357 | 0.007 | 0.247 | 0.262 | 0.123 |
| Pr>F(0.05)-Var | <.0001 | <.0001 | <.0001 | <.0001 | <.0001 | <.0001 | <.0001 | <.0001 | <.0001 |
| Pr>F(0.05)-NxVar | 0.921 | 0.469 | 0.651 | 0.087 | 0.288 | 0.822 | 0.082 | 0.670 | 0.012 |
| HT: height, PM: physiological maturity *(duration from emergence), SS: seed size, MC: moisture content, YLD: yield, PRO:protein, TWT: test weight, TKW: thousand kernel weight, FN: falling number, ns: nonsignificant | |||||||||