Evaluation of Water Use Efficiency of Spring Wheat on Fine Sandy Loam
Project Leaders: Jessica Torrion (PI), Bob Stougaard (Co-PI)
Project Personnel: John Garner, Brooke Bohannon
Link to Evaluation of Water Use Efficiency of Spring Wheat on Fine Sandy Loam Printable PDF
Objective:
To evaluate water use response of spring wheat varieties on yield and quality
Methods:
Eight spring wheat cultivars were grown under six irrigation levels as a split plot, randomized complete block design with four replications, where irrigation levels represent the whole plot and the eight spring wheat varieties were the sub plot factor. The irrigation levels were full irrigation (100ET, FullIrr), deficit irrigation (66ET, 2/3FullIrr), various levels of early irrigation termination events (FullIrr-1, FullIrr-2 FullIrr-3) and a rainfed check. The daily potential evapotranspiration was monitored (Creston Weather Station) and daily crop water use was determined using a crop coefficient approach. To trigger irrigation, daily soil water balance was calculated and plant water availability was maintained above 50% in treatment 100ET and irrigated 1.25 inches each irrigation event. The deficit irrigation followed the same schedule with 100ET, except 0.85 inch was applied for each irrigation event. The FullIrr-3, FullIrr-2, and FullIrr-1 were terminated on June 23, July 6, and July 13, respectively. Details of agronomic management is shown in Table 1. The cumulative amount of water in the dryland and irrigated treatments is shown in Figure 1.
Table 1: Material and Methods |
|||
|---|---|---|---|
| Seeding Date: | 4/22/2015 | Herbicide: | 5/20/2015 |
| Julian Date: | 112 | 13.7 fl oz/A Huskie complete + 0.5 lb/A AMS | |
| Seeding Rate: | 20 plnts/sqft | Pesticide: | 6/19/2015 |
| Previous Crop: | Canola | 12 fl oz/A Quadris + 1.92 fl oz/A Warrior II | |
| Tillage: | Conventional | ||
| Irrigation: | Yes | ||
| Soil Type: | Fine sandy loam | Harvest Date: | 8/13/2015 |
| Soil Test: | 19-6-111 | Julian Date: | 225 |
| Fertilizer: | 281-48-115 | ||
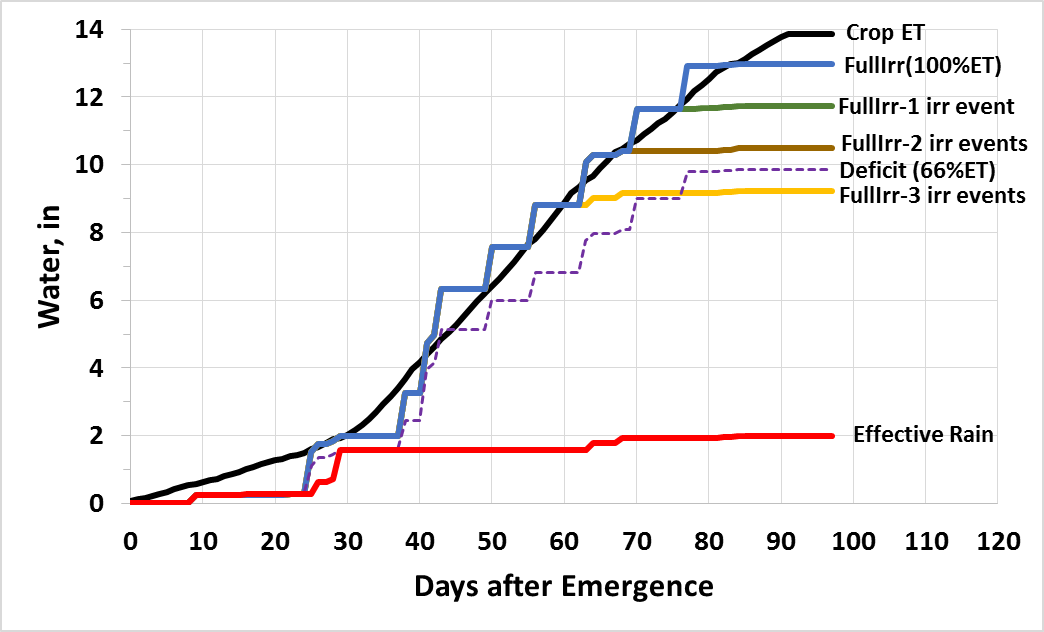
Figure 1. Cumulative rain and irrigation treatments relative to crop water use (Crop ET)
Summary:
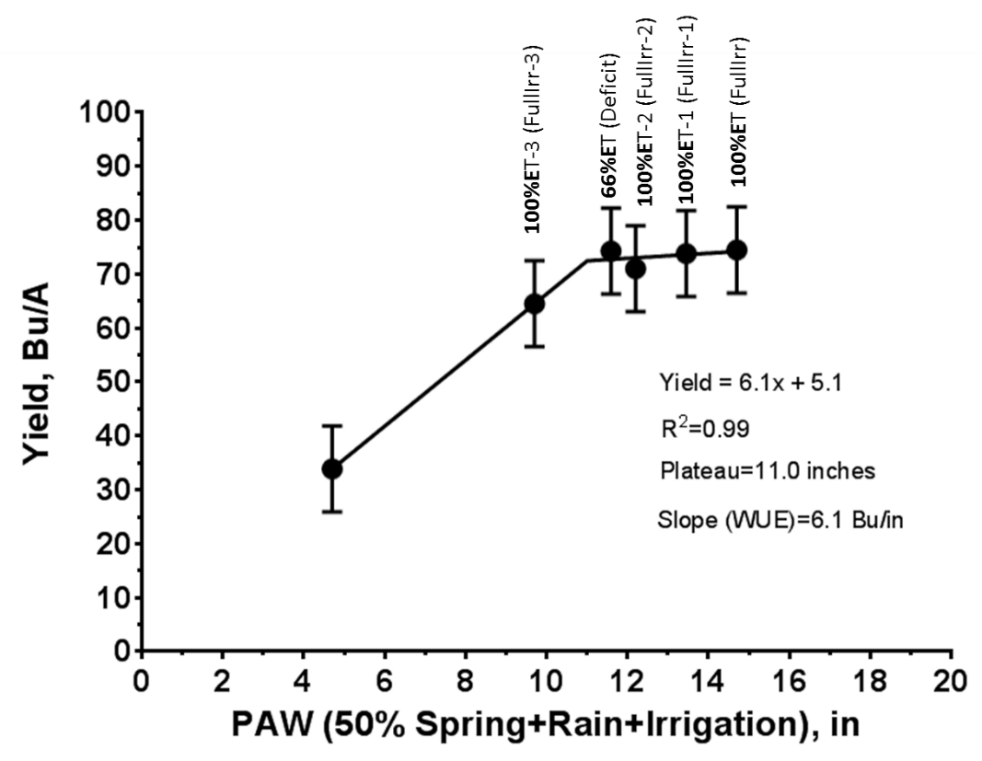
The irrigation main effect was significant among all agronomic traits except protein, still the expected relationship between yield and protein was observed. Volt had the highest yield response while Brennan yielded the least consistently across all water regimes (Figure 2). The maximum yield response was when total plant available water was at 11 inches (Figure 3).
Among varieties, Volt had the highest yield but with the lowest protein due to dilution effect of these two factors. Test weight increased with irrigation, but late season irrigation events that occurred during milk and early dough (FullIrr-1 and FullIrr, respectively) on average decreased test weights, Expresso was the exception.
Heights ranged from 19.8 inches for Cabernet under dryland treatment to 29.4 inches for McNeal under FullIrrig-2 treatment. An interaction between irrigation and varieties was observed for falling number. All varieties had falling number greater than 250 seconds. McNeal had highest falling number for all treatments. Late season rainfall that would have triggered preharvest sprout was lacking. No visible plant lodging was observed.
A significant interaction between irrigation and variety for protein was observed. Late season irrigation appears to increase protein selectively with varieties. An expected relationship between seed size and yield was observed (compare TKW or SS with yield in Table 2). As yield increased with irrigation, seed size decreased due to increased number of seeds per unit area, whereas seed size increased when number of seeds per unit area decreased for low yield.
Table 2. Spring wheat water use effects on agronomic performance |
|||||||||
|---|---|---|---|---|---|---|---|---|---|
| HT | PM* | SS | MC | YLD | PRO | TWT | TKW | FN | |
| Cultivar | in | days | seeds/lb | % | bu/A | % | lb/bu | g | sec |
| Full Irrigation (Fullirrig) | |||||||||
| Brennan | 21.3 | 84 | 12517 | 11.1 | 58.5 | 15.8 | 62.5 | 36.3 | 411 |
| Buck Pronto | 26.2 | 84 | 11295 | 10.6 | 68.5 | 14.4 | 62.0 | 40.8 | 366 |
| Cabernet | 20.7 | 84 | 12446 | 11.4 | 64.6 | 13.8 | 62.7 | 36.6 | 311 |
| Expresso | 26.5 | 86 | 11354 | 11.1 | 85.0 | 14.9 | 62.8 | 40.0 | 305 |
| McNeal | 28.2 | 87 | 11003 | 11.3 | 81.4 | 14.3 | 61.7 | 41.6 | 470 |
| Solano | 22.1 | 86 | 10975 | 11.9 | 77.2 | 14.3 | 62.4 | 41.4 | 334 |
| Volt | 26.8 | 86 | 12503 | 13.0 | 87.8 | 13.5 | 62.4 | 36.3 | 349 |
| WB Rockland | 23.1 | 88 | 10735 | 13.6 | 71.5 | 15.7 | 60.3 | 42.3 | 300 |
| Deficit Irrigation (2/3 Fullirrig) | |||||||||
| Brennan | 21.2 | 83 | 12755 | 10.6 | 52.4 | 16.1 | 62.7 | 35.6 | 402 |
| Buck Pronto | 25.8 | 83 | 10778 | 10.5 | 73.4 | 14.8 | 61.8 | 42.1 | 382 |
| Cabernet | 20.2 | 82 | 12951 | 10.4 | 61.0 | 13.6 | 63.0 | 35.1 | 316 |
| Expresso | 24.7 | 83 | 12027 | 11.2 | 78.1 | 14.2 | 62.6 | 37.8 | 301 |
| McNeal | 28.4 | 85 | 11286 | 10.6 | 79.1 | 14.1 | 61.9 | 40.4 | 504 |
| Solano | 22.8 | 85 | 11316 | 10.6 | 77.3 | 14.2 | 62.8 | 40.2 | 356 |
| Volt | 25.9 | 85 | 12622 | 11.4 | 80.7 | 13.0 | 63.5 | 36.0 | 385 |
| WB Rockland | 23.0 | 85 | 10882 | 12.4 | 66.5 | 15.8 | 60.9 | 41.8 | 292 |
| One Irrigation Event Terminated Early (Fullirrig-1) | |||||||||
| Brennan | 21.3 | 84 | 12322 | 10.6 | 58.8 | 15.9 | 62.9 | 36.9 | 421 |
| Buck Pronto | 25.6 | 84 | 10959 | 10.6 | 70.5 | 14.6 | 62.1 | 41.5 | 367 |
| Cabernet | 21.3 | 83 | 12539 | 10.6 | 70.2 | 13.7 | 63.3 | 36.4 | 320 |
| Expresso | 25.0 | 85 | 11854 | 11.5 | 78.6 | 14.6 | 62.3 | 38.4 | 277 |
| McNeal | 28.4 | 87 | 11390 | 11.2 | 84.0 | 13.9 | 61.7 | 40.1 | 517 |
| Solano | 23.0 | 85 | 11356 | 12.7 | 76.1 | 14.6 | 61.3 | 40.1 | 323 |
| Volt | 27.2 | 86 | 12550 | 12.2 | 90.4 | 13.4 | 62.9 | 36.2 | 371 |
| WB Rockland | 22.8 | 87 | 10977 | 11.0 | 67.9 | 15.2 | 61.5 | 41.4 | 290 |
| Two Irrigation Events Terminated Early (Fullirrig-2) | |||||||||
| Brennan | 21.1 | 83 | 12553 | 10.5 | 57.4 | 15.7 | 62.7 | 36.2 | 425 |
| Buck Pronto | 25.6 | 83 | 11519 | 10.3 | 68.4 | 14.0 | 62.1 | 39.6 | 376 |
| Cabernet | 21.3 | 82 | 12337 | 10.5 | 70.5 | 13.7 | 62.8 | 36.9 | 321 |
| Expresso | 25.4 | 86 | 12049 | 11.5 | 76.5 | 14.6 | 61.9 | 37.7 | 349 |
| McNeal | 29.4 | 87 | 11271 | 11.0 | 86.7 | 13.7 | 61.8 | 40.3 | 521 |
| Solano | 23.3 | 86 | 11556 | 10.6 | 79.8 | 14.2 | 62.9 | 39.3 | 355 |
| Volt | 26.9 | 87 | 13754 | 11.2 | 80.9 | 13.0 | 63.5 | 33.1 | 393 |
| WB Rockland | 22.9 | 87 | 11966 | 12.3 | 70.8 | 16.0 | 61.0 | 38.2 | 313 |
| Three Irrigation Events Terminated Early (Fullirrig-3) | |||||||||
| Brennan | 21.2 | 79 | 12597 | 10.7 | 49.7 | 15.3 | 62.6 | 36.2 | 413 |
| Buck Pronto | 25.3 | 81 | 11510 | 10.3 | 63.4 | 14.9 | 61.3 | 39.5 | 384 |
| Cabernet | 20.6 | 81 | 12609 | 10.6 | 63.4 | 13.5 | 62.6 | 36.1 | 359 |
| Expresso | 23.8 | 83 | 12428 | 10.7 | 69.6 | 14.6 | 62.0 | 36.7 | 310 |
| McNeal | 26.2 | 81 | 12270 | 11.5 | 70.0 | 13.9 | 60.7 | 37.4 | 471 |
| Solano | 23.3 | 83 | 12419 | 10.7 | 68.3 | 14.2 | 62.3 | 36.7 | 354 |
| Volt | 25.2 | 82 | 13204 | 10.8 | 78.8 | 13.1 | 63.4 | 34.6 | 400 |
| WB Rockland | 21.1 | 83 | 11556 | 11.7 | 65.7 | 15.3 | 61.4 | 39.4 | 324 |
| Dryland | |||||||||
| Brennan | 20.5 | 76 | 14993 | 10.3 | 25.5 | 15.4 | 61.8 | 30.3 | 449 |
| Buck Pronto | 22.7 | 78 | 12645 | 10.0 | 36.2 | 14.8 | 61.2 | 36.0 | 399 |
| Cabernet | 16.7 | 76 | 14765 | 10.3 | 25.6 | 14.3 | 61.2 | 30.7 | 361 |
| Expresso | 20.8 | 79 | 12451 | 10.1 | 33.0 | 15.5 | 61.3 | 36.6 | 298 |
| McNeal | 25.1 | 80 | 13343 | 10.2 | 34.4 | 14.5 | 60.7 | 34.2 | 535 |
| Solano | 20.1 | 77 | 12455 | 10.0 | 34.6 | 15.4 | 61.6 | 36.5 | 381 |
| Volt | 22.0 | 79 | 14479 | 10.1 | 40.7 | 13.3 | 63.1 | 31.4 | 416 |
| WB Rockland | 19.8 | 79 | 11860 | 9.8 | 29.2 | 16.1 | 61.3 | 38.3 | 323 |
| CV | 13.4 | 4.3 | 10.0 | 11.1 | 28.3 | 6.7 | 1.8 | 9.7 | 18.9 |
| LSD | 1.4 | 2.8 | 715.8 | 0.8 | 6.3 | ns | 0.6 | 2.4 | 27.0 |
| Pr>F(0.05)-Irr | <.0001 | <.0001 | <.0001 | 0.0002 | <.0001 | 0.3347 | 0.0056 | <.0001 | 0.0026 |
| Pr>F(0.05)-Var | <.0001 | <.0001 | <.0001 | <.0001 | <.0001 | <.0001 | <.0001 | <.0001 | <.0001 |
| Pr>F(0.05)-IrrxVar | 0.8163 | 0.7680 | 0.0115 | 0.2475 | 0.3060 | 0.0035 | 0.2655 | 0.0972 | 0.6269 |
| HT; height, PM: physiological maturity *(duration from emergence), SS: seed size, MC: moisture content, YLD: yield, PRO: protein, TWT: test weight, TKW: thousand kernal weight, FN: falling number, ns: nonsignificant | |||||||||
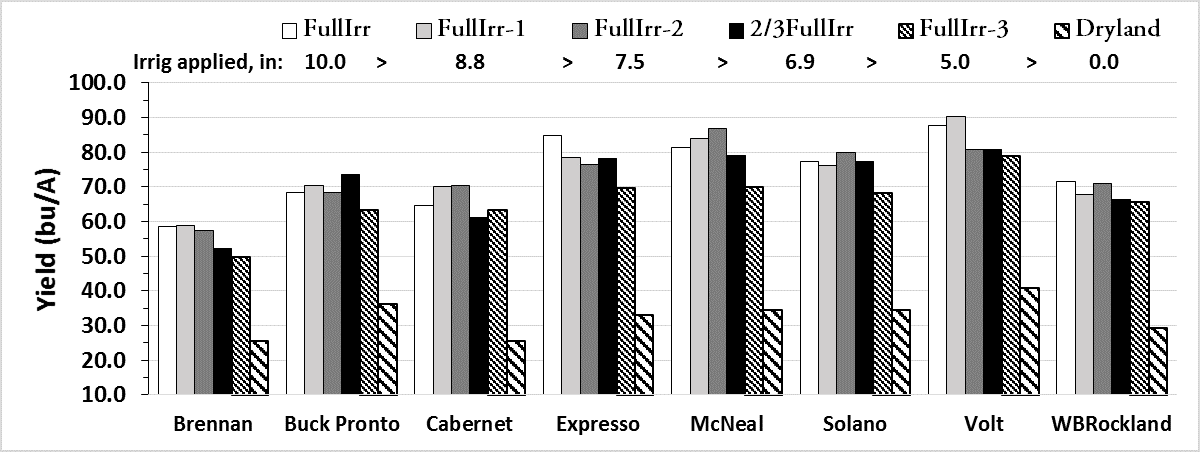
Figure 2. Yield response to water use efficiency of spring wheat on fine sandy loam soil