
Evaluation of Yield and Protein in Rainfed Soft White and Hard Red Spring Wheat
J.A. Torrion, R.N. Stougaard, L. Talbert, J. Garner, B. Bicego-Almeida
Objective:
To evaluate nitrogen use response of spring wheat varieties on yield and quality
Methods:
Eight spring wheat cultivars, including four soft white and four hard red, were grown under five nitrogen (N) levels as a split plot, randomized complete block design with four replications. The N levels represent the whole plot factor and the eight spring wheat varieties were the sub plot factor. The five N treatments included an unfertilized check, 40, 80, 120, and 160 lbs/A added N. The check had an initial 98 lbs/A N. The resulting total N of the five treatments were: 98 (check), 138, 178, 218, and 258 total lbs of N per acre.
Summary:
Highest protein response was achieved at 178 lbs/A N (Figure 1). Protein ranged from 10.28 percent for Alturas to 15.98 percent for Egan (Figure 2, Table 2). Within the hard red spring wheat market class, Egan achieved the highest N whereas Vida had the lowest (Figure 2). No significant differences were observed among the other agronomic traits with N main effect. For rainfed conditions, Vida achieved the highest yield whereas Egan, Solano, and McNeal were equivalent (Figure 3). Refer to Table 3 for yield response - bushels produced per lb of N.
Table 1: Material and Methods - White, Red and Protein - Dryland Spring Wheat |
|||
|---|---|---|---|
| Seeding Date: | 4/21/16 | Herbicide: | 5/17/16 |
| Julian Date: | 112 | Huskie 11 fl oz/A + Axial 16.4 fl oz/A | |
| Seeding Rate: | 25 plnts/sqft | Fungicide: | 6/23/16 |
| Previous Crop: | Alfalfa | 8.2 fl oz/A Prosaro | |
| Tillage: | Conventional | Insecticide: | 6/27/16 |
| Irrigation: | Yes | 1.92 fl oz/A Warrior II | |
| Soil Type: | Fine sandy loam | Harvest Date: | 8/24/16 |
| Soil Test: | 57-10-95 | Julian Date: | 237 |
| Fertilizer: | (__)-63-148 | ||
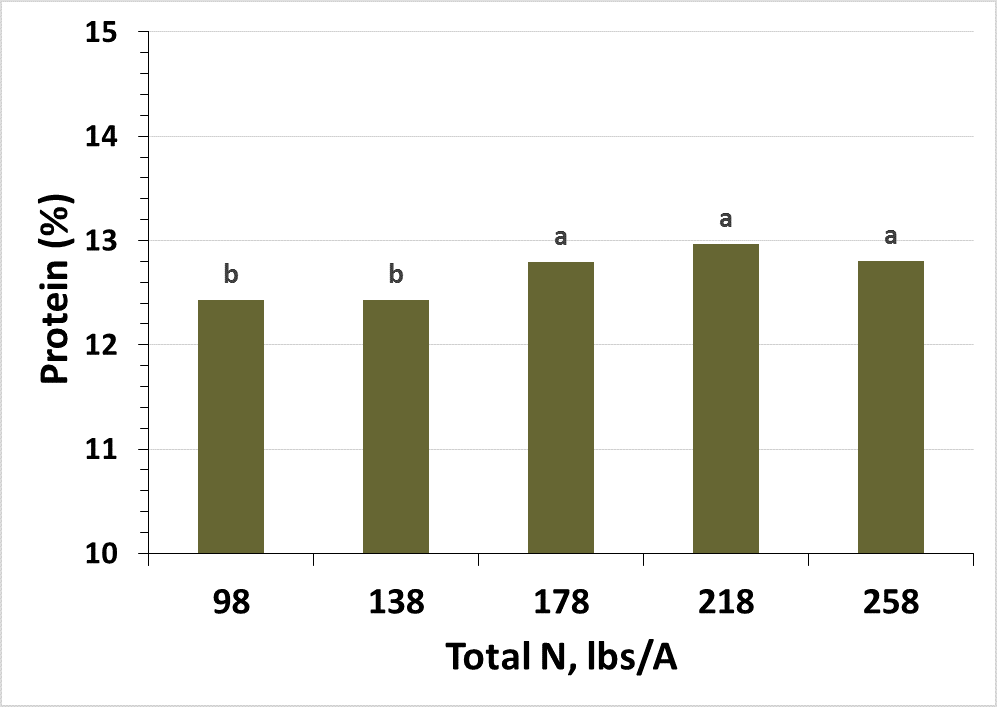
Figure 1.
Mean protein response of rainfed wheat on an irrigated fine sandy loam soil – 2016. Same letter assignment denotes nonsignificance at α =0.05.
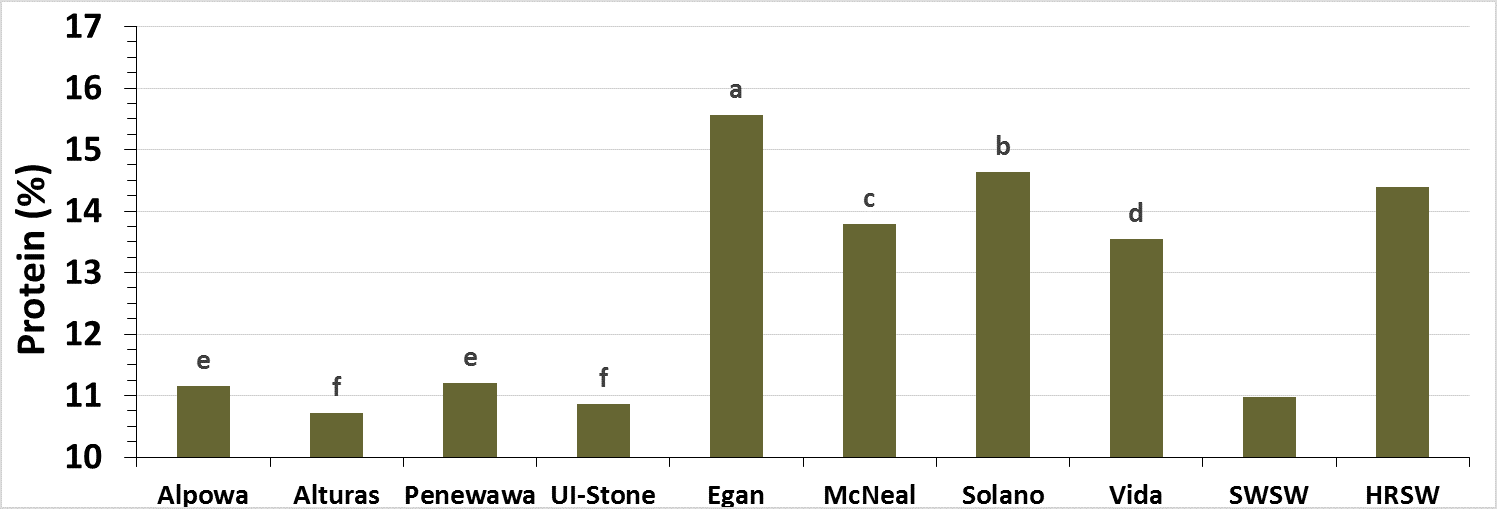
Figure 2.
Mean variety protein response of soft white spring wheat (SWSW) and hard red spring wheat (HRSW). Same letter assignment denotes nonsignificance at α = 0.05.
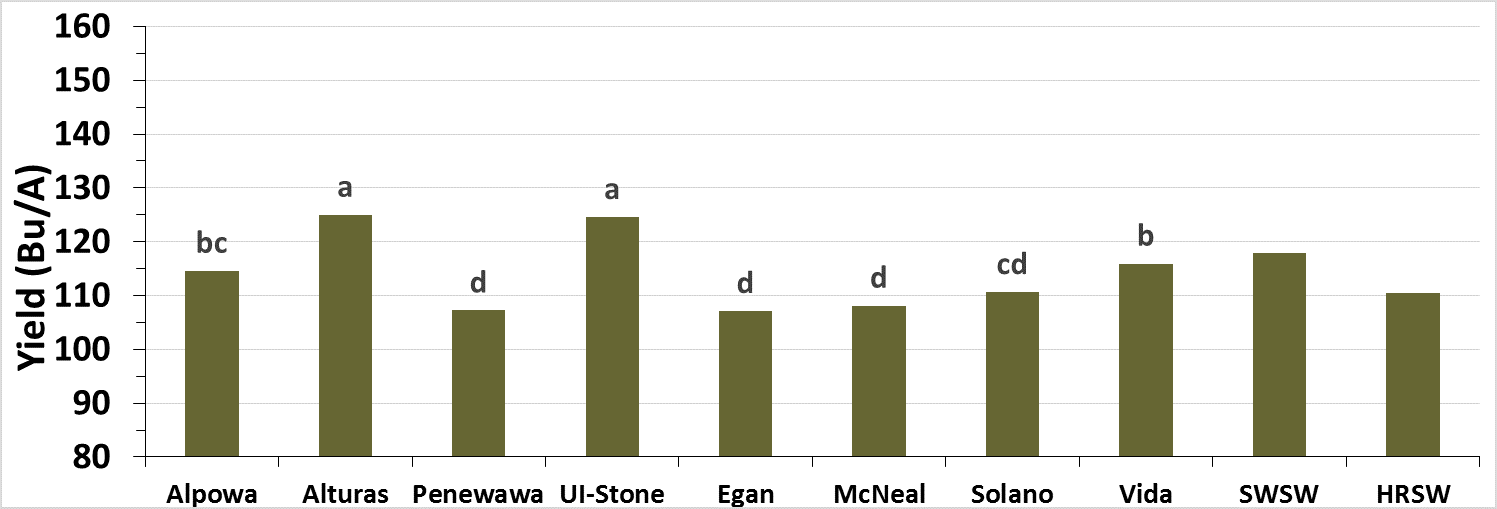
Figure 3.
Mean yield response of soft white spring wheat (SWSW) and hard red spring wheat (HRSW). Same letter assignment denotes nonsignificance at α = 0.05
Table 2. Nitrogen effects on dryland spring wheat agronomic performance |
|||||||||
|---|---|---|---|---|---|---|---|---|---|
| Cultivar | HT | LOD | YLD | PRO | TWT | TKW | FN | PM | MC |
| in | % | bu/A | % | lb/bu | g | sec | days | % | |
| 98 lbs/A Nitrogen (No added fertilizer) | |||||||||
| Alpowa | 35.3 | 7.5 | 117.0 | 11.00 | 63.0 | 39.2 | 413.3 | 93.5 | 10.2 |
| Alturas | 37.8 | 0.0 | 129.0 | 10.40 | 62.0 | 36.9 | 316.5 | 95.3 | 10.2 |
| Penewawa | 34.3 | 0.0 | 111.1 | 11.08 | 62.0 | 38.8 | 352.3 | 92.8 | 10.2 |
| UI-Stone | 35.3 | 17.5 | 120.5 | 10.63 | 61.9 | 37.8 | 344.0 | 93.8 | 10.2 |
| Egan | 37.8 | 0.0 | 108.7 | 15.20 | 61.3 | 38.8 | 510.0 | 94.3 | 10.0 |
| McNeal | 37.5 | 0.0 | 111.5 | 13.50 | 62.4 | 40.3 | 537.0 | 95.0 | 10.1 |
| Solano | 29.3 | 0.0 | 107.8 | 14.35 | 63.1 | 41.1 | 451.5 | 96.8 | 10.3 |
| Vida | 35.0 | 0.0 | 116.8 | 13.30 | 62.8 | 39.3 | 409.5 | 96.8 | 10.5 |
| 138 lbs/A Nitrogen | |||||||||
| Alpowa | 36.5 | 10.0 | 114.8 | 11.08 | 62.6 | 39.9 | 420.3 | 93.8 | 10.2 |
| Alturas | 38.0 | 0.0 | 125.5 | 10.28 | 62.1 | 38.9 | 355.0 | 94.8 | 10.3 |
| Penewawa | 35.0 | 0.0 | 108.4 | 10.88 | 61.9 | 38.2 | 345.3 | 93.3 | 10.3 |
| UI-Stone | 35.0 | 1.3 | 131.8 | 10.80 | 62.5 | 37.4 | 373.3 | 95.0 | 10.3 |
| Egan | 38.3 | 0.0 | 108.5 | 15.30 | 61.3 | 39.3 | 489.3 | 94.0 | 10.0 |
| McNeal | 39.0 | 0.0 | 103.7 | 13.48 | 62.4 | 41.5 | 515.5 | 95.8 | 10.1 |
| Solano | 30.3 | 0.0 | 112.3 | 14.35 | 63.1 | 40.5 | 411.8 | 98.3 | 10.4 |
| Vida | 35.8 | 5.0 | 115.3 | 13.28 | 62.4 | 38.3 | 413.8 | 97.0 | 10.5 |
| 178 lbs/A Nitrogen | |||||||||
| Alpowa | 33.5 | 15.0 | 113.2 | 11.35 | 62.6 | 39.1 | 421.8 | 92.8 | 10.3 |
| Alturas | 37.5 | 5.0 | 128.8 | 10.85 | 62.2 | 38.0 | 313.3 | 94.8 | 10.1 |
| Penewawa | 34.0 | 0.0 | 109.9 | 11.35 | 61.4 | 37.0 | 362.8 | 93.8 | 10.2 |
| UI-Stone | 35.8 | 10.0 | 122.0 | 10.90 | 62.2 | 38.3 | 353.3 | 93.3 | 10.2 |
| Egan | 36.5 | 5.0 | 110.8 | 15.50 | 61.2 | 38.2 | 514.0 | 94.0 | 10.0 |
| McNeal | 36.8 | 0.0 | 107.8 | 14.13 | 62.4 | 42.4 | 523.0 | 94.0 | 10.2 |
| Solano | 29.0 | 0.0 | 112.5 | 14.65 | 62.9 | 42.8 | 453.0 | 97.0 | 10.3 |
| Vida | 34.5 | 5.0 | 115.1 | 13.65 | 62.2 | 38.6 | 413.5 | 95.5 | 10.5 |
| 218 lbs/A Nitrogen | |||||||||
| Alpowa | 34.5 | 2.5 | 112.1 | 11.30 | 63.0 | 40.4 | 388.5 | 94.3 | 10.3 |
| Alturas | 36.5 | 0.0 | 115.8 | 11.03 | 62.4 | 39.0 | 314.0 | 95.0 | 10.2 |
| Penewawa | 32.3 | 0.0 | 100.3 | 11.40 | 62.0 | 39.4 | 338.0 | 94.8 | 10.3 |
| UI-Stone | 34.5 | 0.0 | 125.8 | 11.03 | 62.8 | 38.9 | 342.3 | 94.3 | 10.3 |
| Egan | 36.8 | 0.0 | 100.2 | 15.98 | 61.0 | 39.1 | 511.8 | 93.5 | 10.0 |
| McNeal | 36.5 | 0.0 | 107.3 | 14.03 | 62.5 | 41.8 | 515.0 | 95.3 | 10.1 |
| Solano | 28.5 | 0.0 | 108.6 | 15.03 | 62.9 | 41.8 | 459.3 | 98.8 | 10.3 |
| Vida | 34.5 | 0.0 | 114.7 | 13.98 | 62.6 | 40.4 | 405.5 | 97.5 | 10.5 |
| 258 lbs/A Nitrogen | |||||||||
| Alpowa | 35.8 | 0.0 | 116.0 | 11.03 | 62.7 | 40.0 | 418.3 | 93.8 | 10.4 |
| Alturas | 36.0 | 0.0 | 126.1 | 11.03 | 62.4 | 38.7 | 313.0 | 95.8 | 10.3 |
| Penewawa | 33.5 | 0.0 | 106.6 | 11.35 | 61.8 | 38.1 | 345.8 | 93.8 | 10.3 |
| UI-Stone | 35.3 | 0.0 | 122.9 | 10.95 | 62.3 | 39.1 | 342.5 | 93.3 | 10.3 |
| Egan | 37.0 | 0.0 | 107.6 | 15.88 | 61.0 | 37.2 | 487.3 | 93.3 | 10.0 |
| McNeal | 38.3 | 0.0 | 110.4 | 13.80 | 62.4 | 40.8 | 538.3 | 95.5 | 10.1 |
| Solano | 30.0 | 0.0 | 112.2 | 14.83 | 62.9 | 40.9 | 442.8 | 98.8 | 10.3 |
| Vida | 34.5 | 2.5 | 117.8 | 13.55 | 62.6 | 39.0 | 404.5 | 98.0 | 10.6 |
| LSD | ns | ns | ns | 0.4 | ns | ns | ns | ns | ns |
| Pr>F(0.05) - N | 0.0558 | 0.3906 | 0.4605 | 0.0055 | 0.4938 | 0.1415 | 0.1549 | 0.1111 | 0.2565 |
| Pr>F(0.05) - V | <.0001 | 0.0402 | <.0001 | <.0001 | <.0001 | <.0001 | <.0001 | <.0001 | <.0001 |
| Pr>F(0.05) - N x V | 0.9579 | 0.8892 | 0.9205 | 0.8236 | 0.0791 | 0.8007 | 0.4477 | 0.7054 | 0.7692 |
| FN: falling number, HT: height, LOD: lodging, MC: moisture content, PM: physiological maturity, PRO: protein, TKW: thousand kernel weight, TWT: test weight, YLD: yield, V: variety. | |||||||||
Table 3. nitrogen yield response (Yield per lb N) |
|||||
|---|---|---|---|---|---|
| Variety | 98 | 138 | 178 | 218 | 258 |
| Total N (lbs/A) | |||||
| SWSW | |||||
| Alpowa | 1.17 | 0.83 | 0.64 | 0.53 | 0.44 |
| Alturas | 1.28 | 0.91 | 0.70 | 0.57 | 0.48 |
| Penewawa | 1.09 | 0.78 | 0.60 | 0.49 | 0.42 |
| UI-Stone | 1.27 | 0.90 | 0.70 | 0.57 | 0.48 |
| Average | 1.20 | 0.85 | 0.66 | 0.54 | 0.46 |
| HRSW | |||||
| Egan | 1.09 | 0.78 | 0.60 | 0.49 | 0.42 |
| McNeal | 1.10 | 0.78 | 0.61 | 0.50 | 0.42 |
| Solano | 1.13 | 0.80 | 0.62 | 0.51 | 0.43 |
| Vida | 1.18 | 0.84 | 0.65 | 0.53 | 0.45 |
| Average | 1.13 | 0.80 | 0.62 | 0.51 | 0.43 |