
Evaluation of Yield and Protein in Irrigated Soft White and Hard Red Spring Wheat
J.A. Torrion, R.N. Stougaard, L. Talbert, J. Garner, B. Bicego-Almeida
Objective:
To evaluate nitrogen use response of spring wheat varieties on yield and quality.
Methods:
Eight spring wheat cultivars, including four soft white and four hard red, were grown under five nitrogen (N) levels as a split plot, randomized complete block design with four replications. The N levels represent the whole plot factor and the eight spring wheat varieties were the sub plot factor. The five N treatments included an unfertilized check, 40, 80, 120, and 160 lbs/A added N. The check had an initial 98 lbs/A soil N. The resulting total N of the five treatments were 98 (check), 138, 178, 218, and 258 total lbs N per acre. Supplemental irrigation was applied to keep soil moisture from falling below 50% of the plant available water. Total irrigation applied was 5.7”.
Summary:
N treatment was significant for protein and recorded a maximum protein response at 138 total N/A (Figure 1). Protein ranged from 10.45 percent for UI-Stone to 16.30 percent for Egan (Figure2, Table 2). All other agronomic traits showed no significant difference for N treatment (Table 2). Note that the check (no added N) had high initial N content. Yield and other traits were significant for the variety main effect. On average, yield of soft whites were higher than hard reds (Figure 3). Within hard red market class, Egan yield was significantly depressed from McNeal, but equivalent with Solano and Vida. Egan consistently had high protein. Refer to Table 3 for yield response - bushels produced per lb of N.
Table 1: Material and Methods |
|||
|---|---|---|---|
| Seeding Date: | 4/21/2016 | Herbicide: | 5/17/2016 |
| Julian Date: | 112 | Huskie 11 fl oz/A + Axial 16. fl oz/A | |
| Seeding Rate: | 25 plnts/sqft | Fungicide: | 6/23/2016 |
| Previous Crop: | Alfalfa | 8.2 fl oz/A Prosaro | |
| Tillage: | Conventional | Insecticide: | 6/27/2016 |
| Irrigation: | Yes | 1.92 fl oz/A Warrior II | |
| Soil Type: | Fine sandy loam | Harvest Date: | 8/25/2016 |
| Soil Test: | 57-10-95 | Julian Date: | 238 |
| Fertilizer: | (_)-63-148 | ||
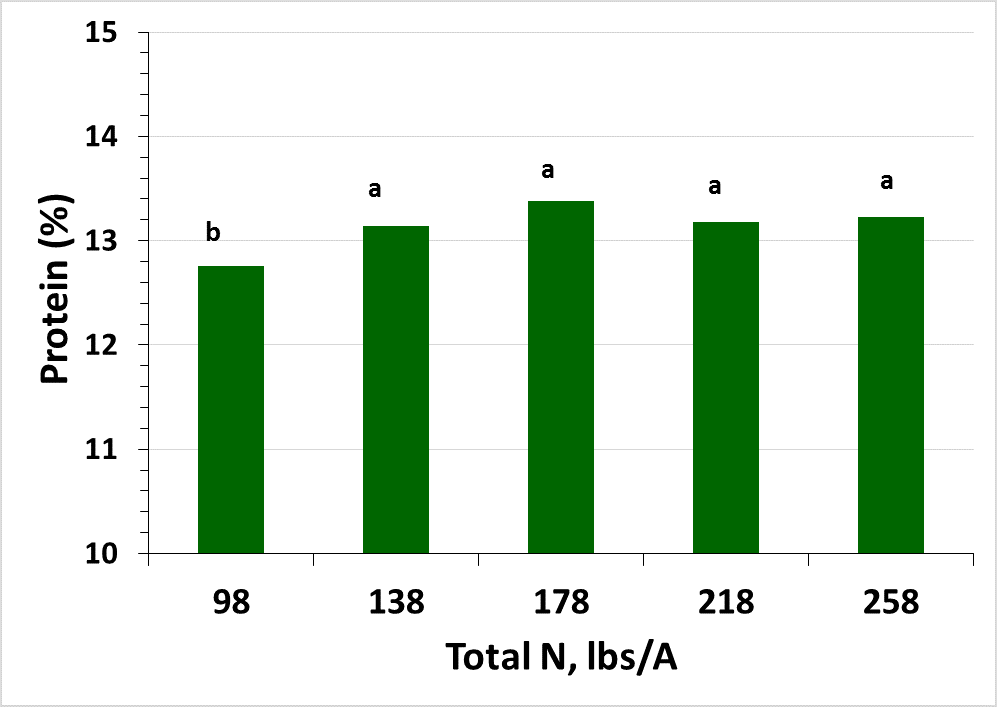
Figure 1.
Mean protein response of irrigated wheat with total nitrogen (N) on an irrigated fine sandy loam soil. Same letter assignment denotes nonsignificance at α =0.05.
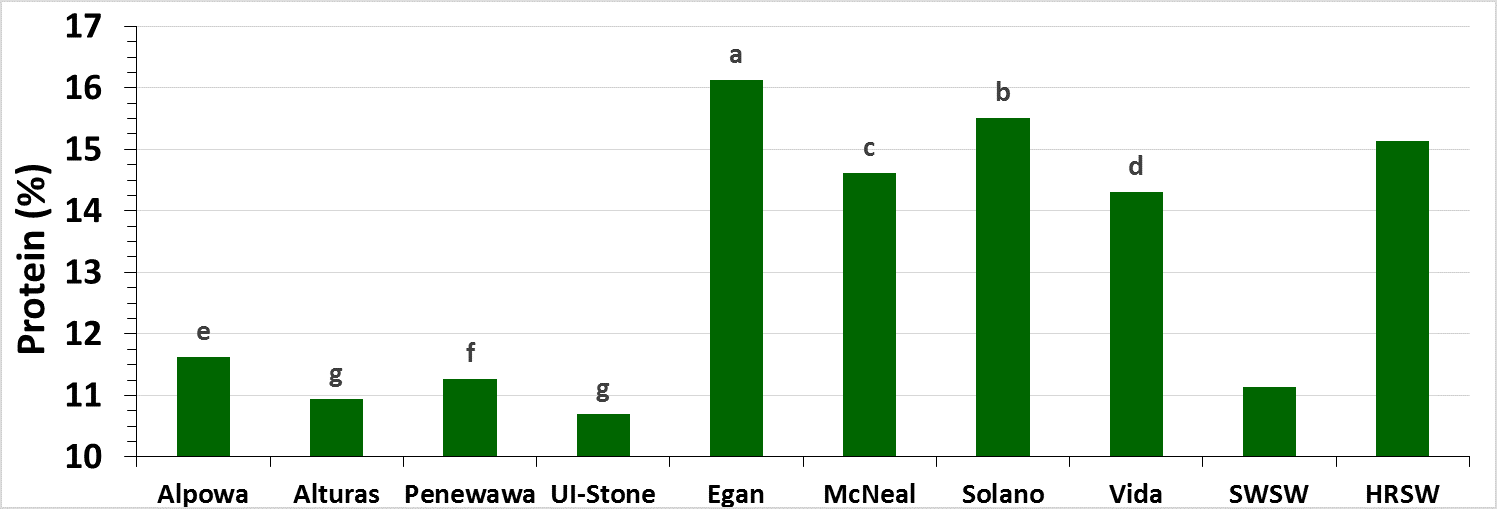
Figure 2.
Mean variety protein response of soft white spring wheat (SWSW) and hard red spring wheat (HRSW). Same letter assignment denotes nonsignificance at α = 0.05.
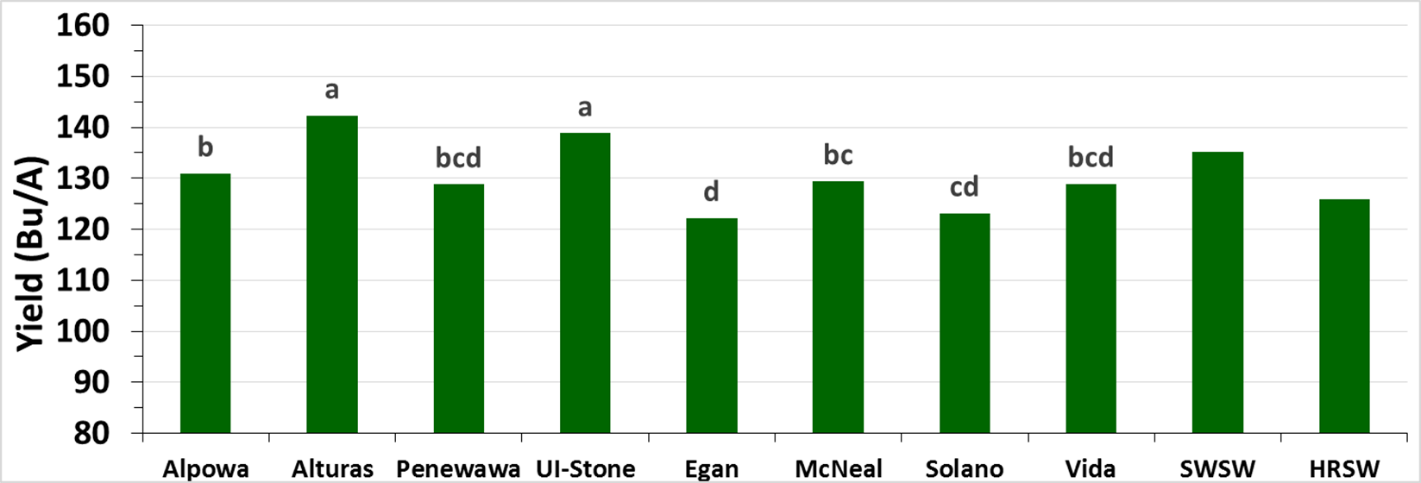
Figure 3.
Mean yield response of soft white spring wheat (SWSW) and hard red spring wheat (HRSW). Same letter assignment denotes nonsignificance at α = 0.05.
Table 2. Nitrogen effects on irrigated spring wheat agronomic performance |
|||||||||
|---|---|---|---|---|---|---|---|---|---|
| Cultivar | HT | LOD | YLD | PRO | TWT | TKW | FN | PM | MC |
| in | % | bu/A | % | lb/bu | g | sec | days | % | |
| 98 lbs/A Nitrogen (no added fertilizer) | |||||||||
| Alpowa | 35.0 | 7.5 | 137.9 | 11.15 | 64.3 | 43.5 | 377 | 100 | 10.9 |
| Alturas | 36.8 | 5.0 | 155.8 | 10.75 | 63.4 | 42.7 | 295 | 103 | 10.9 |
| Penewawa | 35.5 | 2.5 | 133.1 | 10.95 | 63.6 | 42.1 | 331 | 99 | 10.8 |
| UI-Stone | 34.5 | 0.0 | 143.8 | 10.45 | 63.2 | 42.3 | 308 | 100 | 11.0 |
| Egan | 37.8 | 0.0 | 125.2 | 15.38 | 62.5 | 43.0 | 489 | 99 | 10.5 |
| McNeal | 37.3 | 0.0 | 121.8 | 14.08 | 63.3 | 45.7 | 487 | 102 | 10.7 |
| Solano | 28.3 | 0.0 | 127.6 | 15.15 | 63.8 | 39.3 | 398 | 102 | 10.9 |
| Vida | 34.0 | 1.3 | 131.1 | 14.13 | 63.1 | 42.2 | 355 | 103 | 11.1 |
| 138 lbs/A Nitrogen | |||||||||
| Alpowa | 35.0 | 25.0 | 128.1 | 11.55 | 64.0 | 43.3 | 341 | 102 | 11.2 |
| Alturas | 38.0 | 0.0 | 139.4 | 10.98 | 63.1 | 41.5 | 289 | 103 | 11.0 |
| Penewawa | 35.0 | 7.5 | 128.6 | 11.30 | 63.2 | 41.2 | 329 | 100 | 10.9 |
| UI-Stone | 34.0 | 20.0 | 141.8 | 10.85 | 62.8 | 41.9 | 255 | 102 | 11.1 |
| Egan | 35.8 | 10.0 | 121.9 | 16.30 | 62.2 | 42.1 | 478 | 101 | 10.7 |
| McNeal | 39.0 | 12.5 | 131.6 | 14.48 | 63.4 | 45.7 | 464 | 102 | 10.9 |
| Solano | 30.0 | 0.0 | 127.9 | 15.35 | 63.6 | 44.9 | 407 | 103 | 11.4 |
| Vida | 36.0 | 7.5 | 123.8 | 14.33 | 62.8 | 42.3 | 347 | 104 | 11.9 |
| 178 lbs/A Nitrogen | |||||||||
| Alpowa | 35.8 | 2.5 | 131.8 | 11.90 | 64.2 | 43.8 | 357 | 101 | 11.0 |
| Alturas | 37.3 | 5.0 | 139.3 | 11.00 | 63.3 | 41.8 | 277 | 103 | 11.1 |
| Penewawa | 35.0 | 10.0 | 130.8 | 11.40 | 63.5 | 41.5 | 307 | 102 | 10.9 |
| UI-Stone | 33.5 | 25.0 | 146.9 | 10.85 | 63.0 | 41.0 | 291 | 101 | 11.4 |
| Egan | 36.8 | 0.0 | 109.5 | 16.40 | 62.4 | 42.0 | 491 | 101 | 10.7 |
| McNeal | 37.0 | 1.3 | 130.1 | 14.83 | 63.3 | 45.0 | 492 | 102 | 10.8 |
| Solano | 28.5 | 0.0 | 113.7 | 15.85 | 63.6 | 46.0 | 400 | 103 | 10.9 |
| Vida | 34.5 | 1.3 | 127.0 | 14.83 | 62.9 | 42.3 | 346 | 102 | 11.5 |
| 218 lbs/A Nitrogen | |||||||||
| Alpowa | 34.5 | 17.5 | 133.6 | 11.68 | 64.2 | 44.1 | 360 | 100 | 10.9 |
| Alturas | 37.0 | 12.5 | 140.0 | 10.85 | 63.2 | 42.0 | 282 | 102 | 11.1 |
| Penewawa | 33.5 | 5.0 | 118.0 | 11.20 | 63.2 | 42.7 | 328 | 101 | 10.8 |
| UI-Stone | 34.5 | 1.3 | 141.7 | 10.65 | 62.9 | 42.0 | 301 | 99 | 10.8 |
| Egan | 38.8 | 0.0 | 127.0 | 16.28 | 62.4 | 42.0 | 477 | 100 | 10.6 |
| McNeal | 39.3 | 0.0 | 128.1 | 14.73 | 63.3 | 46.1 | 440 | 102 | 10.9 |
| Solano | 29.3 | 0.0 | 127.0 | 15.50 | 63.6 | 45.5 | 396 | 102 | 11.4 |
| Vida | 35.0 | 0.0 | 138.3 | 14.53 | 62.8 | 41.6 | 344 | 104 | 11.9 |
| 258 lbs/A Nitrogen | |||||||||
| Alpowa | 35.5 | 5.0 | 123.5 | 11.83 | 64.1 | 45.2 | 346 | 102 | 11.2 |
| Alturas | 37.5 | 10.0 | 137.2 | 11.10 | 63.3 | 42.6 | 274 | 103 | 11.1 |
| Penewawa | 34.5 | 27.5 | 133.5 | 11.50 | 63.0 | 42.8 | 299 | 101 | 11.0 |
| UI-Stone | 34.3 | 17.5 | 120.2 | 10.70 | 62.9 | 39.6 | 291 | 101 | 11.1 |
| Egan | 37.0 | 2.5 | 127.5 | 16.28 | 62.4 | 40.0 | 461 | 101 | 10.7 |
| McNeal | 37.8 | 2.5 | 135.5 | 14.95 | 63.3 | 46.4 | 473 | 103 | 11.2 |
| Solano | 29.8 | 0.0 | 119.7 | 15.73 | 63.3 | 44.7 | 383 | 105 | 11.6 |
| Vida | 34.3 | 25.0 | 124.5 | 13.70 | 62.4 | 41.5 | 348 | 105 | 11.9 |
| LSD | ns | ns | ns | 0.50 | ns | ns | ns | ns | ns |
| Pr>F(0.05) - N | 0.8506 | 0.6023 | 0.6953 | 0.0441 | 0.3877 | 0.8374 | 0.3642 | 0.6523 | 0.1937 |
| Pr>F(0.05) - Var | <.0001 | 0.0266 | <.0001 | <.0001 | <.0001 | <.0001 | <.0001 | <.0001 | <.0001 |
| Pr>F(0.05) - N x Var | 0.6691 | 0.2489 | 0.1062 | 0.7361 | 0.8687 | 0.0041 | 0.2922 | 0.4980 | 0.0853 |
| HT: height, LOD: lodging, MC: moisture content, PM: physiological maturity, YLD: yield, PRO: protein, TWT: test weight, TKW: thousand kernel weight, FN: falling number, V: variety. | |||||||||
Table 2. Nitrogen productivity (Bushels per lb N) of irrigated soft white spring wheat (SWSW) and hard red spring wheat (HRSW) |
|||||
|---|---|---|---|---|---|
| Variety | 98 | 138 | 178 | 218 | 258 |
| Total N (lbs/A) | |||||
| SWSW | |||||
| Alpowa | 1.34 | 0.95 | 0.74 | 0.60 | 0.51 |
| Alturas | 1.45 | 1.03 | 0.80 | 0.65 | 0.55 |
| Penewawa | 1.31 | 0.93 | 0.72 | 0.59 | 0.50 |
| UI-Stone | 1.42 | 1.01 | 0.78 | 0.64 | 0.54 |
| Average | 1.38 | 0.98 | 0.76 | 0.62 | 0.52 |
| HRSW | |||||
| Egan | 1.25 | 0.89 | 0.69 | 0.56 | 0.47 |
| McNeal | 1.32 | 0.94 | 0.73 | 0.59 | 0.50 |
| Solano | 1.26 | 0.89 | 0.69 | 0.57 | 0.48 |
| Vida | 1.32 | 0.93 | 0.72 | 0.59 | 0.50 |
| Average | 1.29 | 0.91 | 0.71 | 0.58 | 0.49 |