
Managing Water Requirement of Spring Wheat Lines
J.Torrion, L. Talbert, B. Bicego, and A. Sapkota
Link to Managing Water Requirements of Spring Wheat Lines Printable PDF
Objective:
To assess trait adjustment of wheat lines at various water regimes
Methods:
This experiment was conducted on a split-plot design with four replications. The water regime was the main plot, and wheat lines (subplot) were randomly assigned to the main plot. The agronomic management information and water treatments are detailed in Table 1. The nitrogen (N) applied was only 117 lbs/A, but with 33 lbs/A (from residual soil N), the total N in the soil was 150 lbs/A.
Summary:
There was no interaction between water regimes and wheat lines for yield indicating that each wheat lines yielded following the same degree of yield response by the varying amounts of water (Figure 1). This experiment is a validation of our previous experiments that applying the final irrigation at milk stage (100ET.M) does not negatively impact yield (Figure 1A). Also, these lines tolerate moderate deficit irrigation (75ET), but not on the extreme deficit irrigation (50ET) for this year. Yield reduction is expected when the final irrigation being applied at flower (100ETF).
There was also no interaction between water regimes and wheat lines for grain protein indicating that regardless of wheat lines, the degree of response for each of the lines followed the degree of change of protein with water regimes (Figure 2). For this year, the lowest protein attained was with rainfed and with final irrigation applied at flower (100ETF) and other irrigated treatments had higher protein (Figure 2). It was also consistent that the lines with the Gpc-B1 gene (responsible for high protein), had higher protein relative to their respective counterpart line with no Gpc-B1 (Figure 2B). For the tillering alleles, despite the insignificant yield differences between the tillering alleles, the better yielding (numerically) high tiller allele had a depressed protein compared with the low-tiller allele.
Table 1. Agronomic management information
| Soil Type: Flathead Fine Sandy Loam | Seed Treatment: Cruiser Maxx Vibrance | ||
|---|---|---|---|
| Panted/Emerged: May 1st / May 10th | Herbicide @ 4-leaf: | Huskie | |
| Target Plants: 25/ft2 | Fungicide @ Flag Leaf: | Tilt | |
| Water treatments: Rainfed check = 3.0 in | Nutrient applied: | K20 = 33 lbs/A (KCI) | |
| 50ET = +3.5in | 100ET.FL = +3.0 | P2O5 = 84 lbs/A (MAP) | |
| 75 ET = +5.25in | 100ET.M = +5.0in | N=117 lbs/A (Ureaa 46-0-0) | |
| 100ET = +7.0in | Harvested: | August 11th | |
| Footnote: ET, evapotranspiration; KCL, potassium chloride; MAP, monoammonium phosphate | |||
| FL: FLWR (baed on 100ET, but with final irrigation applied at FLWR) | |||
| M: Milk stage (based on 100ET, but with final irrigation applied at milk stage) | |||
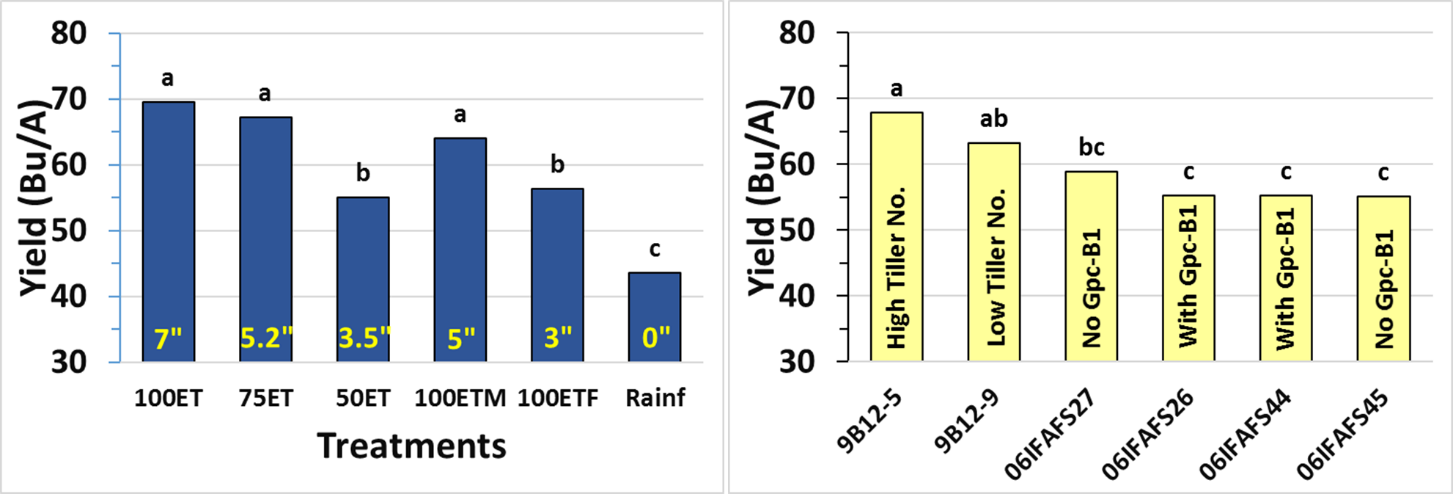
Figure 1.
Yield of irrigation treatments (A), and the respective spring wheat lines (B). Same letter assignment denotes nonsignificance at α=0.05. Total irrigation amounts for each treatment are provided for each of the treatment means.
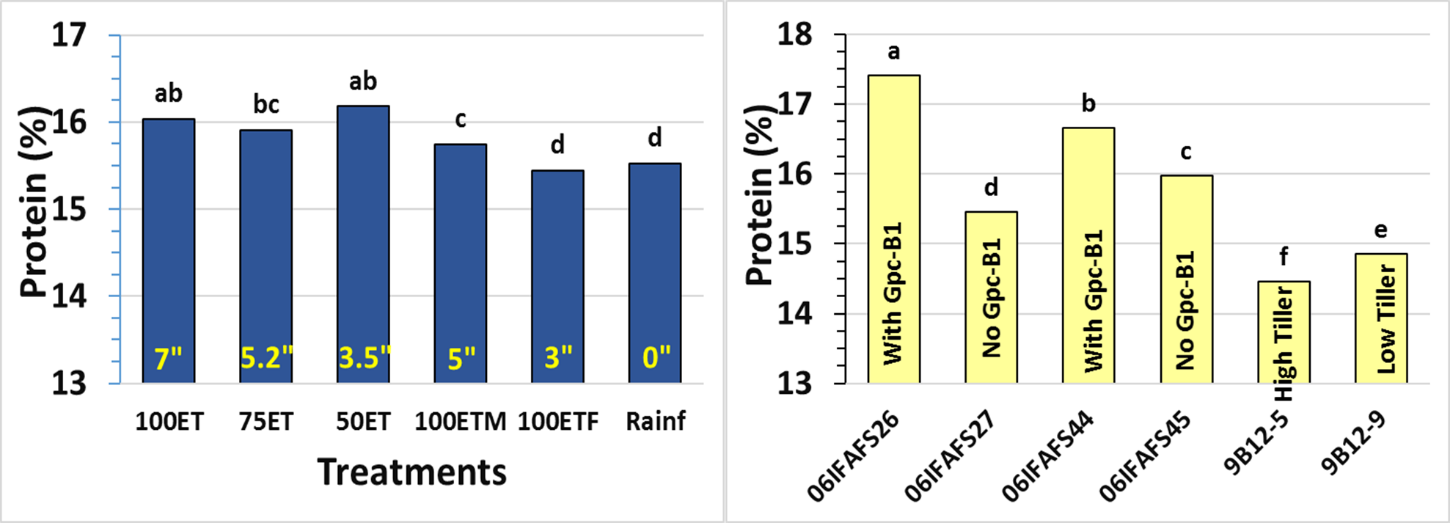
Figure 2.
Grain protein of irrigation treatments (A), and the respective wheat lines (B). Same letter assignment denotes nonsignificance at α=0.05. Total irrigation amounts for each treatment are provided for each of the treatment means.