
Evaluation of Yield and Protein of Hard Red Spring Wheat Under Irrigated and Dryland Condition
B. Bicego., L. Talbert, B. Stougaard, A. Sapkota and J. Torrion
Objective:
To evaluate nitrogen use response of hard red spring wheat varieties on yield and quality
Methods:
The experiment was conducted to determine the optimal nitrogen (N) requirement of four hard red spring wheat varieties (Egan, McNeal, Solano, and Vida) under irrigated and dryland conditions. The unfertilized check treatment had 40 lbs total N per acre based on spring soil sampling, and the fertilized treatments remained the same as 2016 experiment (138, 178, 218 and 258 lbs/A of total N). Urea (46-0-0) was used as N source and applied using a 20-foot boom fertilizer spreader. The fertilizer was mixed into the soil and culti-packed before planting. The dryland environment received 3 inches of rain, and the irrigated environment received an additional 6.6 inches of water. Other management information is presented in Table 1.
Summary:
The N productivity (aka NUE) of irrigated environment diminishes as N increases (Fig. 1A). The irrigated maximum yield response was achieved at 138 lbs/A total N (Fig. 1B). Maximum protein was achieved by this N amount as well (Table 2) regardless of environment. Vida, under the irrigated condition, was the highest yielding variety, but with the lowest protein content. Regardless of the environment, there was no difference in yield between Egan, McNeal, and Solano. Egan had the highest protein content whereas both McNeal and Vida had the lowest grain protein across environments. McNeal and Egan consistently had a high falling number (FN) whereas Solano and Vida had inferior FN across environments. On the other hand, Solano and Vida consistently had high test weight compared to McNeal and Egan across environment (Table 2).
Under the rainfed condition, no N yield response was observed (Table 2). This indicates that one can further reduce N input under dryland production during drought relative to the irrigated environment.
Regarding adjusted gross income, the maximum gross income for the irrigated environment (Figure 1) was consistent with the maximum yield and protein at 138 lbs/A total N (Table 2). For the rainfed environment, further reduction of N input (i.e., lower than 138 lbs/A) is possible based on the no-yield response (Table 2) as well as the adjusted gross income (Figure 2). Egan, Solano, and McNeal were equivalent (Table 2). Vida had the highest gross income despite its low grain protein (Table 2) regardless of environment (Figure 3).
Table 1: Agronomic management information |
|||
|---|---|---|---|
| Soil Type: | Flathead Fine Sandy Loam | Seed Treatment: | Cruiser Maxx Vibrance |
| Planted/Emerged: | May 1st/May 11th | Applied Herbicide @4-leaf | Huskie |
| Target Plants: | 25/ft2 | Fungicide @ Flag Leaf: | Tilt |
| Total Water: | 3 in (Rain) + 6.6 in (Irrigation) | Nutrient Applied: | K2O = 33 lbs/A (KCl) |
| Harvested: | Aug 16th and 17th | P2O5 = 84 lbs/A (MAP) | |
Table 2. Means of the respective varieties, nitrogen treatments, and environment |
||||||||||
|---|---|---|---|---|---|---|---|---|---|---|
| Variety | HT | YLD | PRO | FN | TWT | |||||
| in | bu/A | % | sec | lb/bu | ||||||
| Irr | Dry | Irr | Dry | Irr | Dry | Irr | Dry | Irr | Dry | |
| 40 lbs/A Total Nitrogen (No added fertilizer) | ||||||||||
| Egan | 67.0 | 68.0 | 75.5 | 59.2 | 13.7 | 15.1 | 470.8 | 475.3 | 60.6 | 57.9 |
| McNeal | 70.6 | 70.5 | 75.8 | 64.6 | 12.1 | 13.4 | 498.3 | 498.0 | 60.5 | 58.0 |
| Solano | 57.1 | 59.2 | 75.7 | 62.0 | 13.7 | 13.5 | 399.5 | 405.0 | 62.3 | 60.1 |
| Vida | 70.1 | 70.0 | 90.7 | 76.1 | 12.2 | 12.4 | 367.8 | 385.0 | 62.1 | 60.8 |
| 138 lbs/A Total Nitrogen | ||||||||||
| Egan | 65.9 | 66.5 | 78.0 | 58.1 | 17.1 | 17.0 | 515.8 | 473.3 | 59.8 | 58.3 |
| McNeal | 70.8 | 66.7 | 84.3 | 56.0 | 15.3 | 15.1 | 546.3 | 507.8 | 60.4 | 58.0 |
| Solano | 56.9 | 59.0 | 83.0 | 58.3 | 15.5 | 15.3 | 398.9 | 404.0 | 61.8 | 59.8 |
| Vida | 68.6 | 68.3 | 104.5 | 68.7 | 15.1 | 14.8 | 369.0 | 380.3 | 61.5 | 60.1 |
| 178 lbs/A Total Nitrogen | ||||||||||
| Egan | 64.6 | 65.3 | 73.6 | 61.6 | 17.4 | 17.1 | 461.5 | 480.5 | 59.7 | 58.2 |
| McNeal | 64.8 | 68.2 | 82.3 | 60.4 | 15.5 | 15.3 | 511.3 | 500.8 | 60.3 | 58.1 |
| Solano | 56.9 | 57.5 | 79.1 | 61.2 | 16.1 | 15.5 | 386.3 | 407.3 | 61.9 | 59.9 |
| Vida | 67.9 | 67.6 | 99.6 | 67.1 | 15.4 | 14.7 | 348.8 | 366.0 | 61.6 | 59.6 |
| 218 lbs/A Total Nitrogen | ||||||||||
| Egan | 66.2 | 68.1 | 74.7 | 62.3 | 17.3 | 17.1 | 488.5 | 484.8 | 59.4 | 58.2 |
| McNeal | 69.4 | 67.5 | 85.5 | 61.3 | 15.5 | 15.5 | 501.3 | 488.3 | 60.5 | 58.3 |
| Solano | 57.1 | 59.6 | 76.5 | 58.8 | 15.8 | 15.7 | 402.3 | 402.0 | 61.3 | 59.6 |
| Vida | 72.1 | 70.3 | 97.0 | 76.9 | 15.1 | 14.8 | 367.8 | 385.8 | 61.5 | 60.0 |
| 258 lbs/A Total Nitrogen | ||||||||||
| Egan | 66.9 | 66.6 | 83.8 | 52.9 | 17.3 | 17.4 | 471.3 | 480.5 | 59.9 | 57.2 |
| McNeal | 69.8 | 69.5 | 84.5 | 54.3 | 15.8 | 15.8 | 479.0 | 481.8 | 60.8 | 57.6 |
| Solano | 57.6 | 57.6 | 81.8 | 55.8 | 16.0 | 15.9 | 392.8 | 421.8 | 61.8 | 59.7 |
| Vida | 68.85 | 69.6 | 99.2 | 69.8 | 15.3 | 14.9 | 340.8 | 371.8 | 61.4 | 60.0 |
| Pr>F (0.05)- N | 0.0601 | 0.9576 | <0.0001 | 0.2051 | 0.0320 | |||||
| Pr>F (0.05)- E | 0.8208 | 0.0048 | 0.6213 | 0.6994 | <0.0001 | |||||
| Pr>F (0.05)- N x E | 0.9030 | 0.0385 | 0.0087 | 0.3327 | 0.1431 | |||||
| HT: Height, YLD: Yield, PRO: Protein, FN: Falling Numbers, TWT: Test Weight | ||||||||||
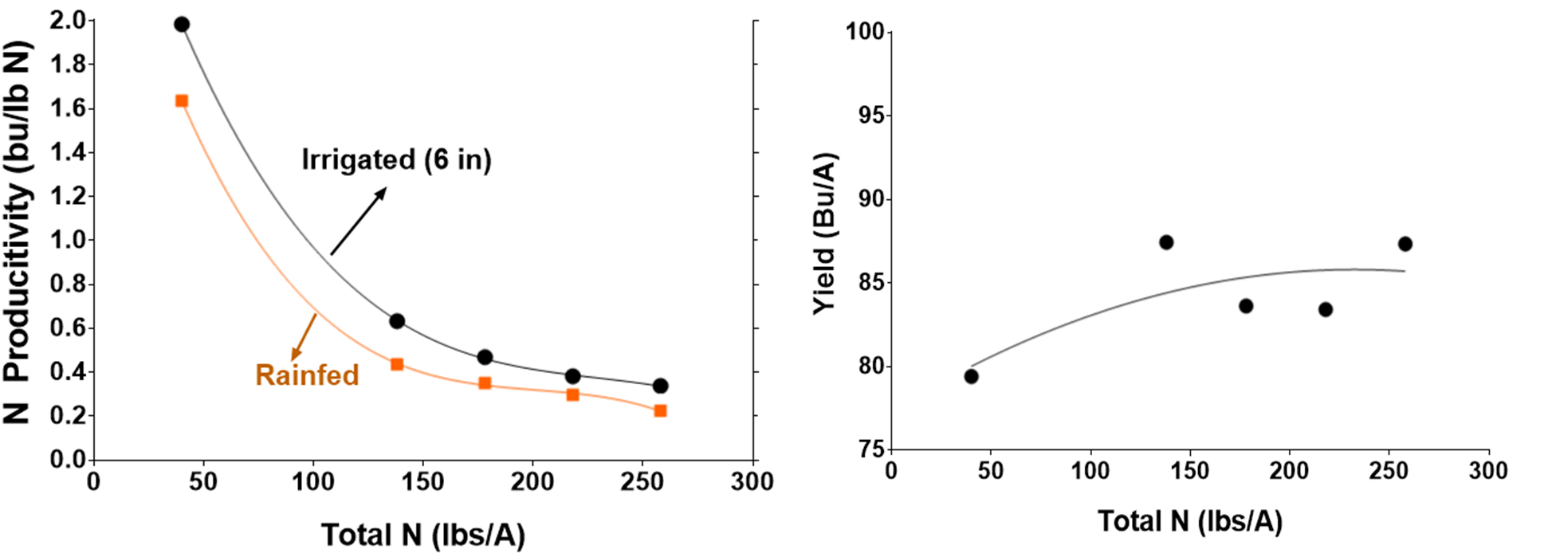
Figure 1.
Nitrogen (N) productivity of irrigated and rainfed hard red spring wheat (A), and N response curve of the irrigated environment (B).
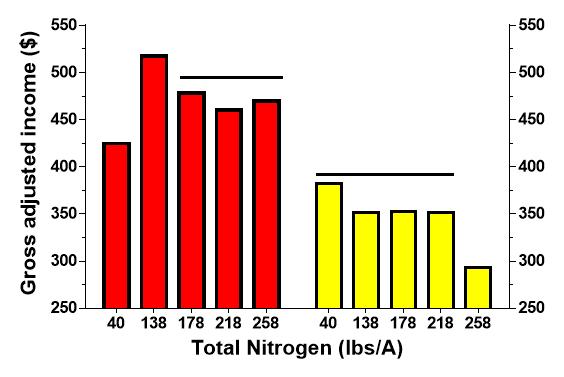
Figure 2.
Adjusted gross income of applied additional N from the reference check 40 lbs/N. Lines on top of the bar charts indicate equivalency of the N treatments.
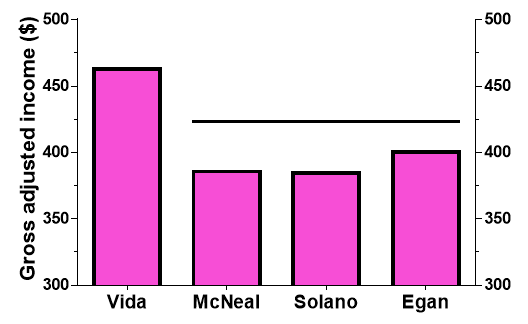
Figure 3.
Adjusted gross income of when choosing varieties. Lines on top of the bar charts indicate equivalency of the varieties.