
Evaluation of Yield and Protein of Soft White Spring Wheat Under Irrigated and Dryland Condition
B. Bicego., L. Talbert, B. Stougaard, A. Sapkota and J. Torrion
Objective:
To evaluate nitrogen use response of soft white spring wheat varieties on yield and quality
Methods:
The experiment was conducted to determine the optimal nitrogen (N) requirement of four soft white spring wheat varieties (Alpowa, Alturas, Penewawa, and UI-Stone) under irrigated and dryland conditions. The unfertilized check treatment had 40 lbs total N per acre based on spring soil sampling and the fertilized treatments remained the same as 2016 experiment (138, 178, 218 and 258 lbs/A of total N). Urea (46-0-0) was used as N source and applied using a 20-foot boom fertilizer spreader. The fertilizer was mixed into the soil and culti-packed before planting. The dryland environment received 3 inches of rain, and the irrigated environment received an additional 6.6 inches of water. Other management information is presented in Table 1.
Summary:
In 2017, UI-Stone and Alturas had higher yields compared with Alpowa and Penewawa under irrigated condition (Table 2, Figure 1). UI-Stone consistently had the lowest protein content which is advantageous for this market class. Dryland environment resulted in lower yields compared to the irrigated, and no significant difference was observed between UI-Stone, Alturas, and Alpowa. Higher protein contents were observed in dryland conditions. For both environments, no increase in protein was observed after applying more than 138 lbs/A of N. Ideally, 8.5 to 10.5% protein is recommended. Therefore, there is an opportunity for reduction of N input for this market class regardless of environment. Alpowa consistently had the highest falling number (FN) across environments whereas Alturas consistently had the lowest FN. Nevertheless, none of them was lower than 300 seconds (Table 2), but we suspect that further lowering of FN in Alturas is expected during wet and cold August months.
In general, dryland environment had lower adjusted gross income compared to the irrigated. Year 2017 was a hot and drought year (Table 1). UI-Stone was the most profitable variety in both environments, but in dryland, it was not significantly different than Alturas and Alpowa (Figure 1). The N treatment did not affect yield and applying 138 lbs/A of nitrogen increased the protein content to a higher level than the industry requirement resulting in price discounts. Thus, further reduction of N lower than the 138 lbs/A guarantees better gross adjusted income (Figure 2).
Table 1: Agronomic management information |
|||
|---|---|---|---|
| Soil Type: | Flathead Fine Sandy Loam | Seed Treatment: | Cruiser Maxx Vibrance |
| Planted/Emerged: | May 1st/May 11th | Applied Herbicide @4-leaf | Huskie |
| Target Plants: | 25/ft2 | Fungicide @ Flag Leaf: | Tilt |
| Total Water: | 3 in (Rain) + 6.6 in (Irrigation) | Nutrient Applied: | K2O = 33 lbs/A (KCl) |
| Harvested: | Aug 16th and 17th | P2O5 = 84 lbs/A (MAP) | |
Table 2. Means of the respective varieties, nitrogen treatments, and environment |
||||||||||
|---|---|---|---|---|---|---|---|---|---|---|
| Variety | HT | YLD | PRO | FN | TWT | |||||
| in | bu/A | % | sec | lb/bu | ||||||
| Irr | Dry | Irr | Dry | Irr | Dry | Irr | Dry | Irr | Dry | |
| 40 lbs/A Total Nitrogen (No added fertilizer) | ||||||||||
| Alpowa | 64.9 | 68.7 | 88.7 | 70.1 | 10.00 | 11.4 | 376.8 | 405.5 | 62.6 | 60.0 |
| Alturas | 63.8 | 67.9 | 102.0 | 67.8 | 10.10 | 11.0 | 301.8 | 310.3 | 62.0 | 59.1 |
| Penewawa | 66.0 | 66.2 | 90.8 | 67.2 | 10.00 | 11.3 | 351.3 | 355.3 | 62.4 | 59.7 |
| UI-Stone | 64.7 | 67.6 | 101.1 | 76.3 | 9.60 | 11.3 | 315.0 | 374.3 | 62.1 | 60.4 |
| 138 lbs/A Total Nitrogen | ||||||||||
| Alpowa | 65.2 | 67.3 | 97.2 | 65.9 | 12.30 | 12.7 | 424.0 | 410.3 | 62.7 | 60.2 |
| Alturas | 67.2 | 66.0 | 108.7 | 66.2 | 11.50 | 12.3 | 315.3 | 317.8 | 62.5 | 59.8 |
| Penewawa | 67.0 | 64.5 | 95.8 | 58.3 | 12.60 | 12.7 | 376.0 | 357.0 | 62.5 | 59.3 |
| UI-Stone | 66.5 | 65.3 | 116.0 | 67.0 | 11.30 | 12.7 | 358.0 | 378.0 | 62.6 | 59.9 |
| 178 lbs/A Total Nitrogen | ||||||||||
| Alpowa | 66.6 | 67.7 | 89.5 | 67.4 | 12.70 | 12.5 | 417.0 | 408.0 | 62.6 | 60.5 |
| Alturas | 65.4 | 64.8 | 102.6 | 65.0 | 12.00 | 12.4 | 302.0 | 320.3 | 62.9 | 60.0 |
| Penewawa | 65.4 | 66.2 | 87.1 | 66.4 | 12.70 | 12.6 | 339.3 | 335.5 | 62.0 | 60.2 |
| UI-Stone | 64.6 | 96.1 | 101.4 | 68.1 | 11.50 | 12.8 | 343.8 | 375.5 | 62.8 | 60.2 |
| 218 lbs/A Total Nitrogen | ||||||||||
| Alpowa | 67.5 | 67.4 | 96.8 | 65.6 | 12.40 | 12.9 | 400.5 | 417.0 | 62.4 | 60.1 |
| Alturas | 66.6 | 68.5 | 104.1 | 70.4 | 11.70 | 12.5 | 303.3 | 333.0 | 62.7 | 59.7 |
| Penewawa | 65.7 | 67.4 | 93.1 | 65.4 | 12.80 | 13.0 | 347.0 | 357.0 | 62.3 | 59.2 |
| UI-Stone | 66.4 | 65.5 | 106.3 | 73.0 | 11.60 | 12.5 | 345.5 | 393.3 | 63.0 | 60.8 |
| 258 lbs/A Total Nitrogen | ||||||||||
| Alpowa | 64.3 | 66.3 | 90.2 | 67.1 | 12.70 | 12.9 | 379.0 | 401.0 | 62.5 | 60.1 |
| Alturas | 66.3 | 67.3 | 109.4 | 68.2 | 11.60 | 12.5 | 304.8 | 331.5 | 62.7 | 60.3 |
| Penewawa | 67.3 | 64.2 | 91.7 | 58.0 | 12.80 | 13.2 | 368.5 | 332.8 | 62.0 | 59.4 |
| UI-Stone | 63.8 | 65.4 | 107.6 | 68.1 | 11.60 | 13.1 | 331.8 | 360.5 | 63.0 | 60.1 |
| Pr>F (0.05)- N | 0.4381 | 0.7169 | <0.0001 | 0.2196 | 0.2613 | |||||
| Pr>F (0.05)- E | 0.3527 | 0.0016 | 0.0029 | 0.2315 | <0.0001 | |||||
| Pr>F (0.05)- N x E | 0.3262 | 0.1134 | 0.0094 | 0.4437 | 0.7340 | |||||
| HT: Height, YLD: Yield, PRO: Protein, FN: Falling Numbers, TWT: Test Weight | ||||||||||
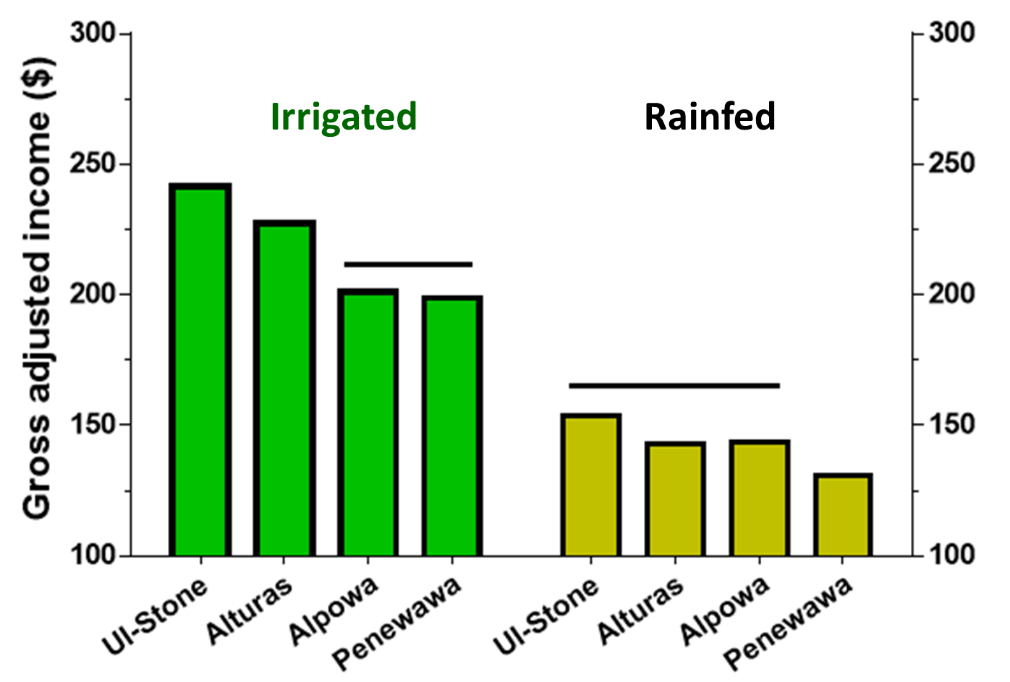
Figure 1.
Adjusted gross income by variety. Lines on top of the bar charts indicate equivalency of the N treatments.
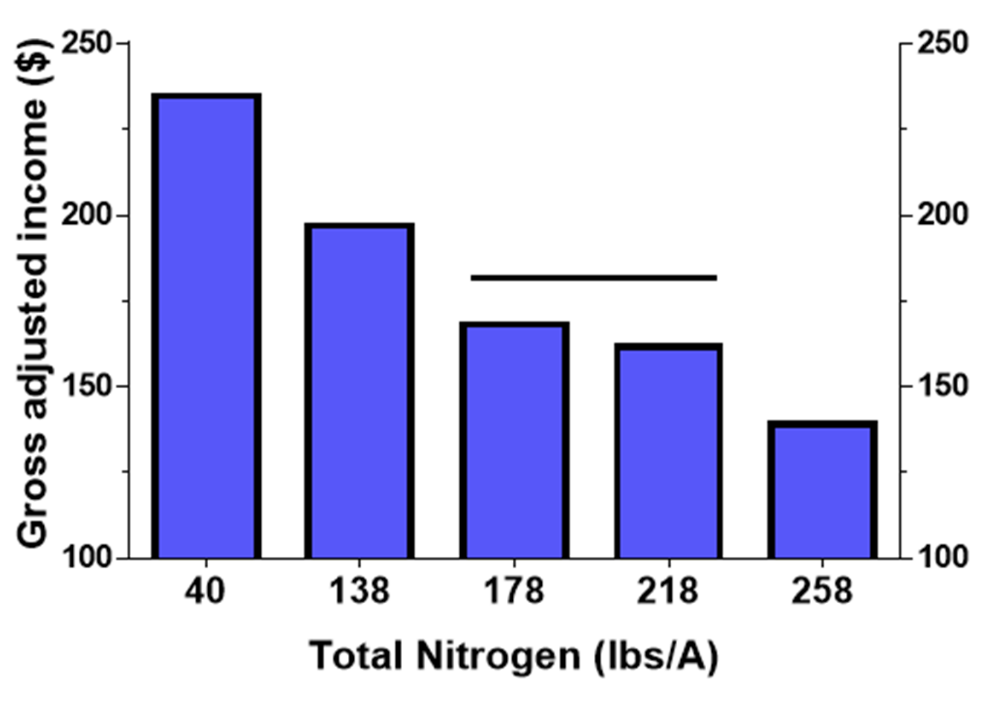
Figure 2.
Adjusted gross income of applied additional N from the reference check 40 lbs/N. Lines on top of the bar charts indicate equivalency of the varieties.