Performance of Talinor for Weed Control in Winter Wheat
Link to Performance of Talinor for Weed Control in Winter Wheat Printable PDF
Objective:
Compare Talinor to competitive products for crop tolerance and weed control.
Materials and Methods:
The previous crop was a forage mix of barley, oat and peas. The field was fertilized with 9-30-70 on September 21 and Colter winter wheat was planted on September 27, 2016 (Table 1). A supplemental fertilizer application of 75-0-40 was broadcast to the winter wheat crop on May 1, 2017. Herbicide treatments were applied on May 5, 2017 using a CO2 backpack sprayer equipped with TeeJet XR11002 nozzles in a volume of 20 GPA. Crop height averaged 10 inches and plants had a minimum of one tiller. Weeds present at application consisted of pennycress (THLAR), tumble mustard (SSYAL) and prickly lettuce (LACSE) and were five inches in height.
Results:
All treatments afforded excellent crop tolerance (Table 2). Similarly, all treatments provided excellent control of pennycress and tumble mustard, except for Widematch which failed to control pennycress. Few treatments provided acceptable control of prickly lettuce (Table 3). Talinor applied at 16 and 18.2 oz/A provided at least 90% control as did the combination of Affinity tankmix plus Widematch.
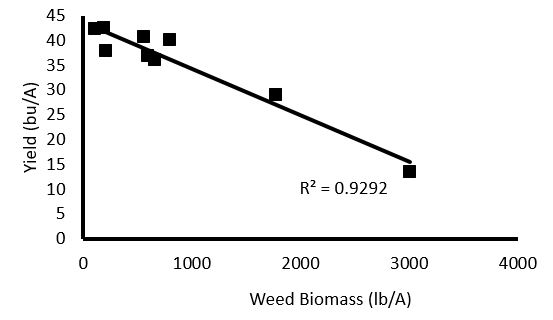
Overall, there was a linear relationship between winter wheat yield and weed biomass (Figure 1). All herbicide treatments reduced weed biomass relative to the check, but among the herbicide treatments, Widematch resulted in the greatest weed biomass. Although wheat yields were affected by the level of weed control, drought and high temperature conditions also suppressed yields, which were about one-third of normal. Wheat yields averaged 36 bu/A in this study. Grain protein averaged about 11% in the study and was unaffected by herbicide treatment. Test weights were low, averaging about 57 lb/bu. Interestingly, the highest test weights was observed with Widematch.
Summary:
Talinor treatments afforded the most complete weed control and weed control did improve as the rate of Talinor increased.
Table 1. Materials and Methods. |
|||
| Seeding Date: | 9/27/2016 | Harvest Date: | 8/7/2017 |
| Julian Date: | 271 | Julian Date: | 219 |
| Seeding Rate: | 125 lb/A | Soil Type: | Creston SiL |
| Previous Crop: | forage mix | Soil Test: | 70-44-113 |
| Tillage: | Conventional | Fertilizer: | 9-30-70, 75-0-40 |
Table 2. Effect of Talinor on Weed Control in Winter Wheat |
|||||||||||||
|
Treatment |
Rate |
5/12 | 5/20 | 5/26 | 5/20 | 5/26 | 6/9 | 8/3 | 5/20 | 5/26 | 6/9 | 8/3 | |
| CI | CI | CI | THLAR | THLAR | THLAR | THLAR | SSYAL | SSYAL | SSYAL | SSYAL | |||
| % | % | % | % | % | % | % | % | % | % | % | |||
| Check | 0 | 0 | 0 | 0 | 0 | 0 | 0 | 0 | 0 | 0 | 0 | ||
| CoAct | 2.75 | fl oz/a | 3 | 0 | 0 | 96 | 98 | 98 | 100 | 97 | 98 | 98 | 98 |
| Talinor | 13.7 | fl oz/a | |||||||||||
| Herbimax | 1 | % v/v | |||||||||||
| CoAct | 3.2 | fl oz/a | 3 | 0 | 0 | 98 | 98 | 98 | 100 | 98 | 98 | 98 | 100 |
| Talinor | 16 | fl oz/a | |||||||||||
| Herbimax | 1 | % v/v | |||||||||||
| CoAct | 3.6 | fl oz/a | 2 | 2 | 0 | 97 | 98 | 98 | 100 | 98 | 98 | 98 | 100 |
| Talinor | 18.2 | fl oz/a | |||||||||||
| Herbimax | 1 | % v/v | |||||||||||
| Huskie 2.07 EC | 11 | fl oz/a | 3 | 0 | 0 | 97 | 98 | 98 | 100 | 98 | 98 | 98 | 100 |
| Activator 90 | 0.25 | % v/v | |||||||||||
| Widematch 1.5EC | 16 | fl oz/a | 2 | 0 | 0 | 57 | 35 | 15 | 0 | 66 | 98 | 97 | 99 |
| Affinity Tankmix 50 SG | 0.6 | oz/a | 3 | 0 | 0 | 80 | 92 | 95 | 97 | 95 | 98 | 98 | 100 |
| Widematch 1.5EC | 16 | fl oz/a | |||||||||||
| Activator 90 | 0.25 | % v/v | |||||||||||
| Affinity Tankmix 50 SG | 0.6 | oz/a | 5 | 0 | 0 | 82 | 90 | 95 | 100 | 98 | 98 | 98 | 100 |
| MCPA Ester 3.7 EC | 12 | fl oz/a | |||||||||||
| Orion | 17 | fl oz/a | 0 | 0 | 0 | 84 | 86 | 95 | 100 | 98 | 98 | 98 | 100 |
| Mean | 2 | 0 | 0 | 77 | 77 | 77 | 77 | 83 | 87 | 87 | 89 | ||
| LSD P=.05 | 5.802 | 1.666 | . | 14.749 | 6.886 | 4.169 | 3.331 | 11.915 | 0.333 | 0.999 | 1.053 | ||
| CV | 143.66 | 519.62 | 0 | 11.11 | 5.15 | 3.13 | 2.49 | 8.29 | 0.22 | 0.66 | 0.69 | ||
| Treatment Prob(F) | 0.6612 | 0.4726 | 1 | 0.0001 | 0.0001 | 0.0001 | 0.0001 | 0.0001 | 0.0001 | 0.0001 | 0.0001 | ||
| CI: Crop injury, THLAR: Pennycress, SSYAL: Tumble mustard. | |||||||||||||
Table 3. Effect of Talinor on Weed Control in Winter Wheat |
|||||||||||
| Treatment | Rate | 5/20 | 5/26 | 6/9 | 8/3 | 7/3 | 7/3 | 8/7 | 8/7 | 8/7 | |
| LACSE | LACSE | LACSE | LACSE | Weeds | Wheat | YLD | PRO | TWT | |||
| % | % | % | % | lb/A | lb/A | bu/A | % | lb/bu | |||
| Check | 0 | 0 | 0 | 0 | 3005 | 4850 | 14 | 11.00 | 57.6 | ||
| CoAct | 2.75 | fl oz/a | 91 | 88 | 91 | 72 | 201 | 8658 | 38 | 11.38 | 56.4 |
| Talinor | 13.7 | fl oz/a | |||||||||
| Herbimax | 1 | % v/v | |||||||||
| CoAct | 3.2 | fl oz/a | 96 | 94 | 96 | 90 | 98 | 9768 | 42 | 11.12 | 57.6 |
| Talinor | 16 | fl oz/a | |||||||||
| Herbimax | 1 | % v/v | |||||||||
| CoAct | 3.6 | fl oz/a | 96 | 95 | 95 | 92 | 181 | 7692 | 43 | 11.11 | 57.6 |
| Talinor | 18.2 | fl oz/a | |||||||||
| Herbimax | 1 | % v/v | |||||||||
| Huskie 2.07 EC | 11 | fl oz/a | 96 | 89 | 93 | 83 | 551 | 6506 | 41 | 11.16 | 56.8 |
| Activator 90 | 0.25 | % v/v | |||||||||
| Widematch 1.5EC | 16 | fl oz/a | 83 | 93 | 95 | 78 | 1767 | 5930 | 29 | 10.87 | 58.9 |
| Affinity Tankmix 50 SG | 0.6 | oz/a | 85 | 94 | 98 | 94 | 653 | 6431 | 36 | 11.21 | 57.8 |
| Widematch 1.5EC | 16 | fl oz/a | |||||||||
| Activator 90 | 0.25 | % v/v | |||||||||
| Affinity Tankmix 50 SG | 0.6 | oz/a | 89 | 91 | 92 | 63 | 592 | 6594 | 37 | 11.15 | 56.9 |
| MCPA Ester 3.7 EC | 12 | fl oz/a | |||||||||
| Orion | 17 | fl oz/a | 86 | 89 | 91 | 55 | 796 | 6233 | 40 | 11.11 | 57.0 |
| Mean | 80 | 81 | 83 | 70 | 872 | 6962 | 36 | 11.12 | 57.4 | ||
| LSD P=.05 | 8 | 9.485 | 6.826 | 23.035 | 840 | 2620 | 10.32 | 0.447 | 0.953 | ||
| CV | 5.75 | 6.73 | 4.73 | 19.11 | 55.7 | 21.74 | 16.78 | 2.32 | 0.95 | ||
| Treatment Prob(F) | 0.0001 | 0.0001 | 0.0001 | 0.0001 | 0.0001 | 0.0316 | 0.0005 | 0.5628 | 0.0029 | ||
|
LACSE: Prickley lettuce, YLD: Yield, PRO: Protein, TWT: Test weight.
|
|||||||||||
Figure 1. Relationship between weed biomass and yield