
Assessing Alfalfa Yield & Quality Under Different Irrigation Strategies To Increase Production Efficiencies
J.A. Torrion, Ze Fang, Amanda Shine
Objective:
To examine yield of various fall dormancies with moisture levels
Summary:
There was no interaction existed between variety and water treatment for yield. Varieties showed a consistently linear response to increasing amounts of applied water. Among the cultivars, both Hi-gest and Big Sky had the lowest yields, whereas the other four varieties with higher yields were equivalent to each other.
At first cutting (7/24-7/26) yields were significantly different between the rainfed and the 100E % of evapotranspiration (ET; 100ET) treatments, but not significant between 100ET and 50ET or between 50ET and rainfed. Rainfall leading up to the first harvest date was adequate enough such that only about 2.5” of irrigation was applied to 100ET and just over 1” applied to the 50ET. However, between first and second cuttings the gap between the amounts of water applied to the irrigated plots vs. precipitation received by the rainfed plots widened.
Table 1. Management Information |
|||
|---|---|---|---|
| Planting date: | 5/21/2018 | 1st cutting: | 7/24 – 7/26 |
| Emergence: | 5/28/2018 | 2nd cutting: | 9/26 – 9/27 |
| Target Seeding (seeds/ft2): | 25 | Weed control: | Pursuit (6/25); manual weeding |
| Seeding depth: | 0.5 inch | Other pest control: | None |
| Soil type: | Creston silt loam | Total irrigation: 50ET | 5.0 inches |
| : 100ET | 10.0 inches | ||
| Total precipitation (5/21-9/27) | 4.1 inches | ||
| Previous crop: | Barley | Nutrient fertilizer applied (lbs/A): | 0-0-100 |
Table 2.
Seasonal yield and yield by cuttings of various cultivars subjected to moisture regimes.
| Cuttings | ----------------First------------- | --------------Second----------- | --------------Total--------------- | ||||||
| Variety (Fall Dormancy) | ---------------------------------------------------Tons/A------------------------------------------------ | ||||||||
| 100 ET | 50ET | Rainfed | 100 ET | 50ET | Rainfed | 100 ET | 50ET | Rainfed | |
| Cisco II (6) | 1.4 | 1.2 | 1 | 2 | 1.5 | 0.5 | 3.4 | 2.7 | 1.5 |
| FSG229CR (2) | 1.5 | 1.2 | 1 | 1.9 | 1.3 | 0.6 | 3.4 | 2.5 | 1.6 |
| Maxi Graze (2) | 1.4 | 1.2 | 1 | 1.8 | 1.5 | 0.5 | 3.3 | 2.7 | 1.5 |
| Rugged (3) | 1.5 | 1.3 | 1 | 1.8 | 1.4 | 0.6 | 3.2 | 2.6 | 1.5 |
| Big Sky (3) | 1.3 | 1.1 | 1 | 1.8 | 1.3 | 0.6 | 3.1 | 2.4 | 1.6 |
| Hi Gest (6) | 1.4 | 1.1 | 0.9 | 1.6 | 1.3 | 0.6 | 3 | 2.4 | 1.4 |
| Mean | 1.4 | 1.2 | 1 | 1.8 | 1.4 | 0.5 | 3.2 | 2.6 | 1.5 |
| CV | 0.05 | 0.06 | 0.04 | 0.07 | 0.06 | 0.08 | 0.05 | 0.05 | 0.05 |
| LSD | ns | ns | ns | 0.21 | ns | ns | ns | ns | ns |
| Pr>F | 0.4348 | 0.4217 | 0.8156 | 0.0034 | 0.0675 | 0.7139 | 0.0541 | 0.1207 | 0.9501 |
| ns: not significant at alpha = .05 | |||||||||
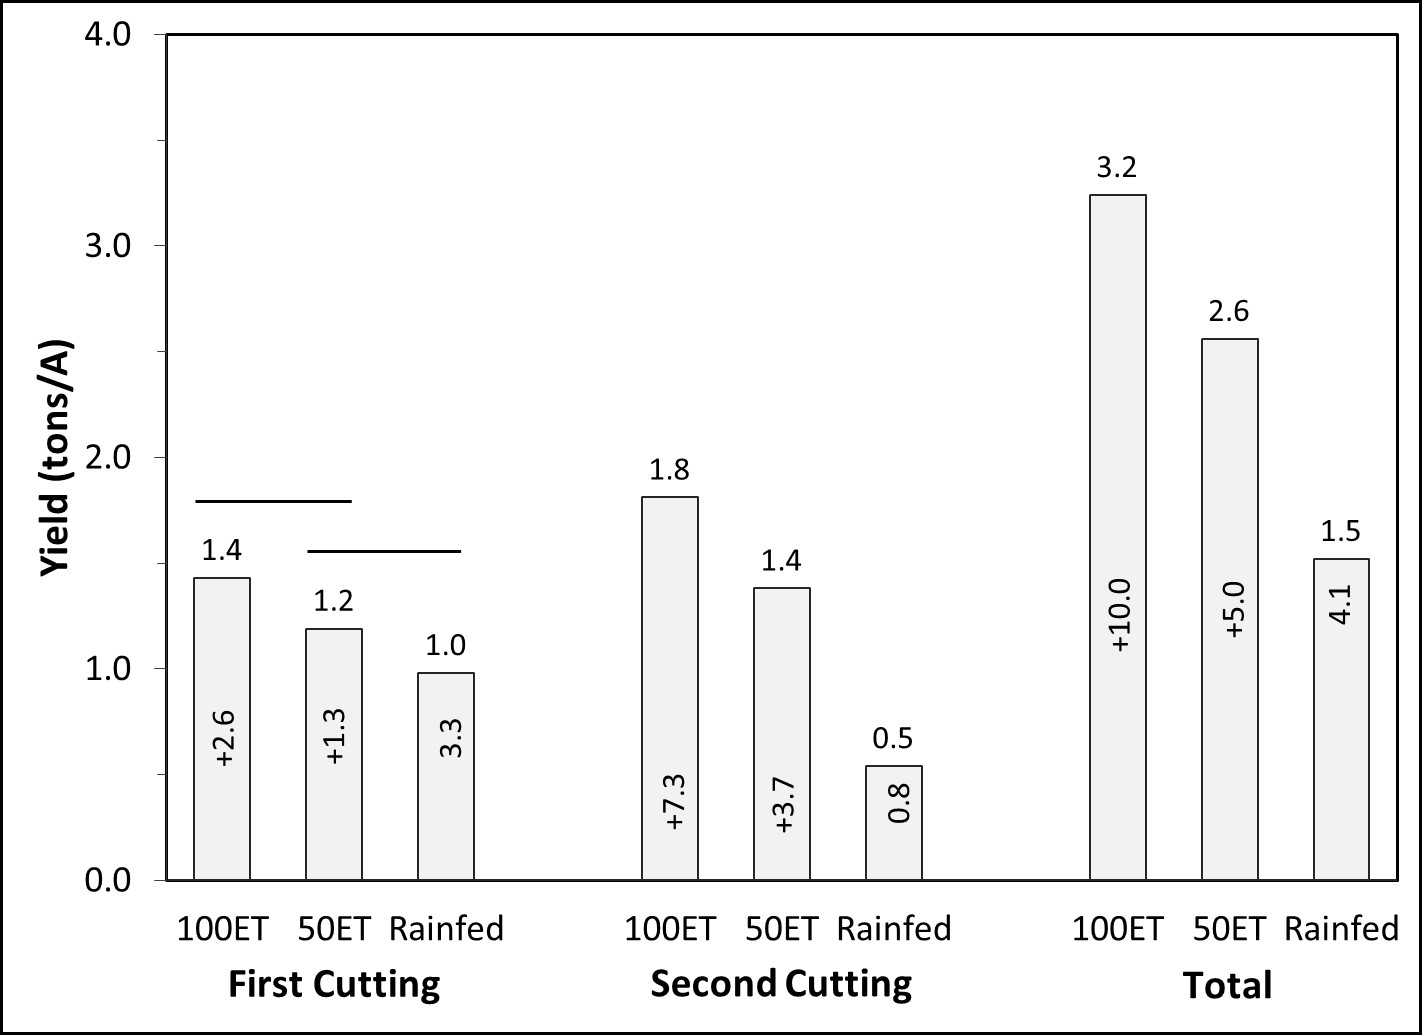
Figure 1.
Total yield and yield by irrigation treatment per cutting. Numbers inside each bars are irrigation amounts for 50% of evapotranspiration (ET; 50ET) and 100ET and precipitation amounts for rainfed treatments. Horizontal lines on top of the first cutting bars indicate the lack of significant difference between water regimes.