
Spring Wheat Planting Population Study
J.A. Torrion, Ze Fang, Amanda Shine
Link to Spring Wheat Planting Population Study Printable PDF
Objective:
To determine the optimal planting population and the agronomic impacts of plant population in wheat
Summary:
Six spring wheat varieties with four planting density combinations were planted in a complete randomized block design with 3 replications. The six varieties were Egan, Expresso, Solano, Soren, Tyra, and Vida. The four target planting population were: 16, 24, 32, and 40 plants/ft2. Each plot was sampled for tiller and plant count. Management information is available in Table 1 and agronomic performance data is shown by population density in Table 2.
Table 1. Management information. |
|||
|---|---|---|---|
| Seeding date: | 5/2/2018 | Harvest date: | 8/30/2018 |
| Julian date: | 122 | Julian date: | 242 |
| Seeding rates: | 16, 24, 32, and 40 plants/ft2 | Soil type: | Creston silt loam |
| Previous crop: | pea | Soil Nutrient Residual (lb/A): | 123-6-82 (Fall, 2017) |
| Tillage: | conventional | Nutrient fertilizer applied (lb/A): | 40-40-100 |
| Insecticide: | Warrior2 | Fungicide: | Headline |
All graphed results are shown using actual populations. All traits were significant for varieties, but protein, thousand kernel weight, plant height, biomass at heading, and falling number were not significant between planting densities. Variety and density interaction was insignificant indicating that varieties behaved similarly under various densities.
Yields for planting densities of 24, 32, and 40 were the same as shown in Figure 1A. These three densities achieved the same number of kernels per ft2 (Fig. 1B). Increasing planting density had more number of plants as expected, but the number of productive tillers per plant was also reduced (Fig. 1C). Thus, yields (Fig. 1A) and the resulting income did not improve (Fig. 1D).
Optimum planting density for spring wheat, based on this study with diverse varieties and tillering capacities, is 24 plants/ft2 under well-watered condition. The soil this experiment was planted was with subsurface recharge (abundant soil moisture). Previous year’s (2017) result under rainfed and drought conditions, yields recorded were the same for 16, 24, 32, and 40 plants/ft2 seeding -- in which actual live plants were on par with the target population.
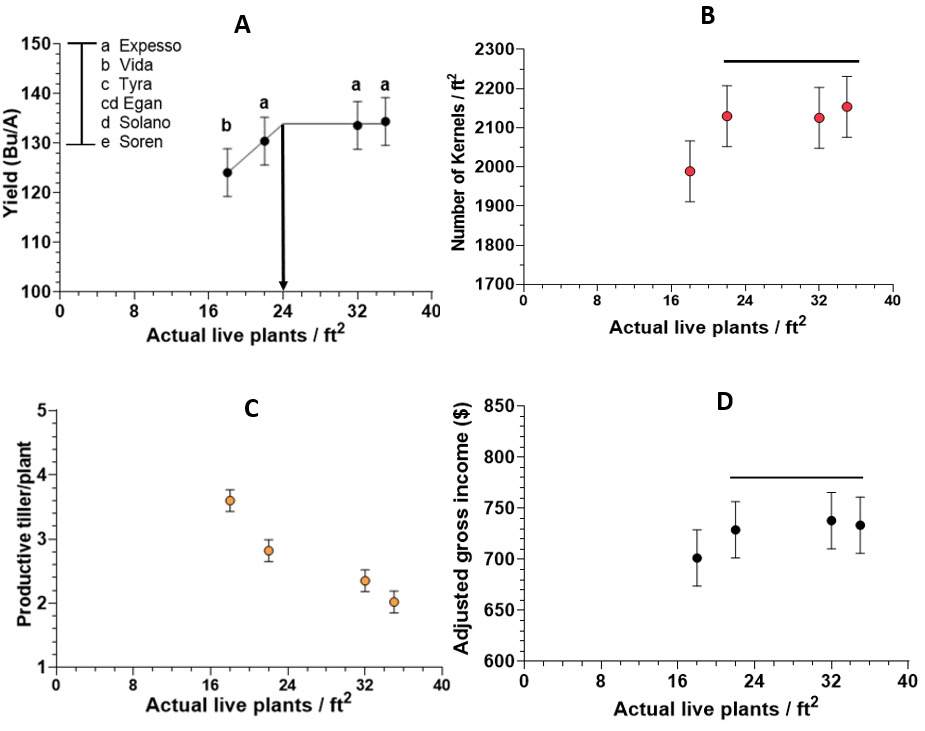
Figure 1
A) Yield, B) number of kernels per ft2, C) productive tiller per plant, and D) adjusted gross income of actual live plants per ft2.
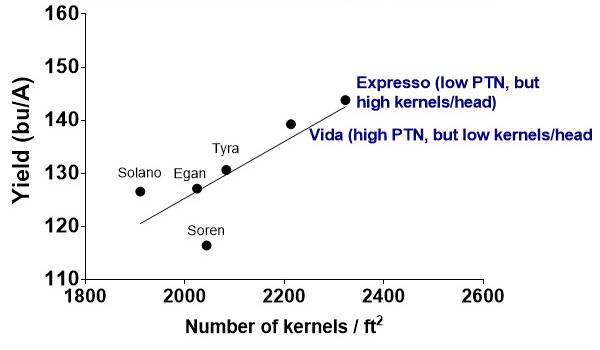
Figure 2
As shown in Figure 2, the tillering capacity of wheat is not a straightforward determinant of yield. The example is Expresso showing low productive tiller number (PTN; Table 2), but produced high yield. Vida on the other hand had high yield even with low number of kernels per head (smaller heads) but it produced high PTN.
Our results indicate that planting more seeds/ft2 because a variety has low tillering capacity, does not guarantee increases in yield and income. The data suggest that under optimal growing condition, 24 plants/ft2 is sufficient (Fig 1A; Table 2).
Table 1: Agronomic performance
| Variety | PLNT | HD | HT | No. Kernels | PTN | Biomass | YLD1 | PRO2 | TWT1 | TKW | FN |
|---|---|---|---|---|---|---|---|---|---|---|---|
| line | sqft | Julian | in | no./ft2 | no./plant | lb/ft2 | bu/A | % | lb/bu | g | Seconds |
| 16 plants/ft2 | |||||||||||
| Expresso | 19.3 | 181 | 34.6 | 2318.6 | 2.5 | 0.35 | 141.9 | 14.8 | 57.4 | 40.9 | 293.2 |
| Vida | 23.1 | 180 | 40.5 | 2049 | 4 | 0.35 | 134.8 | 14 | 61.8 | 41.2 | 358.1 |
| Tyra | 15.3 | 180 | 33.6 | 1917.3 | 4.8 | 0.28 | 122.9 | 13.3 | 62.5 | 40.3 | 318.2 |
| Egan | 20.4 | 181 | 39 | 1923.2 | 3.5 | 0.38 | 120.7 | 16.3 | 61.3 | 38.9 | 414.8 |
| Solano | 17.6 | 180 | 30.4 | 1791.3 | 2.6 | 0.28 | 114.9 | 14 | 61.9 | 40 | 339.9 |
| Soren | 13.3 | 179 | 35.2 | 1933.1 | 3.9 | 0.29 | 109.3 | 15.1 | 62.8 | 35.2 | 375.8 |
| Mean | 18.2 | 180 | 35.5 | 1988.8 | 3.6 | 0.3 | 124.1 | 14.6 | 61.3 | 39.4 | 350 |
| 24 plants/ft2 | |||||||||||
| Expresso | 24.8 | 181 | 36.1 | 2351.4 | 2.1 | 0.34 | 144.2 | 14.6 | 59 | 40.3 | 301.4 |
| Vida | 20.9 | 180 | 39.4 | 2371 | 3.4 | 0.35 | 136.5 | 13.9 | 62 | 36.3 | 345.7 |
| Tyra | 24.5 | 179 | 33.9 | 2059.9 | 3.5 | 0.31 | 131 | 13.2 | 62.3 | 39.9 | 296.6 |
| Solano | 19.7 | 180 | 31.5 | 1864.3 | 2.4 | 0.31 | 127.7 | 14.2 | 62.1 | 43 | 344 |
| Egan | 20.4 | 180 | 39.4 | 2048.5 | 2.7 | 0.33 | 127.3 | 16.3 | 61.6 | 38.5 | 446.9 |
| Soren | 20.6 | 179 | 33.5 | 2059.9 | 2.9 | 0.28 | 115.9 | 14.8 | 63 | 34.9 | 392.4 |
| Mean | 21.8 | 180 | 35.6 | 2129.7 | 2.8 | 0.3 | 130.4 | 14.5 | 61.7 | 38.8 | 354.5 |
| 32 plants/ft2 | |||||||||||
| Expresso | 32.8 | 180 | 35.9 | 2363.1 | 1.9 | 0.31 | 149 | 14.3 | 59.1 | 41.4 | 297.2 |
| Vida | 28.8 | 179 | 38.6 | 2180.6 | 2.7 | 0.35 | 141.3 | 14.1 | 61.8 | 40.7 | 363.2 |
| Tyra | 34 | 179 | 33.6 | 2141.2 | 2.8 | 0.31 | 131.8 | 13.2 | 62.6 | 38.7 | 305.9 |
| Solano | 30.9 | 179 | 32.5 | 1959.5 | 1.9 | 0.29 | 129.3 | 14 | 62.5 | 41.2 | 354.3 |
| Egan | 37.8 | 180 | 38.8 | 2029.7 | 2.3 | 0.4 | 128.9 | 16 | 61.8 | 39.4 | 439.6 |
| Soren | 27.6 | 178 | 34.5 | 2078.6 | 2.5 | 0.31 | 121.3 | 14.9 | 63.3 | 36.2 | 372.9 |
| Mean | 32 | 179 | 35.7 | 2125.4 | 2.4 | 0.3 | 133.6 | 14.4 | 61.9 | 39.6 | 355.5 |
| 40 plants/ft2 | |||||||||||
| Vida | 35.3 | 179 | 40.1 | 2251.3 | 2.6 | 0.35 | 144.5 | 14 | 62.3 | 40.2 | 347.7 |
| Expresso | 34.9 | 180 | 35.3 | 2257.1 | 1.6 | 0.3 | 140.1 | 14.4 | 59.9 | 40.5 | 305.1 |
| Tyra | 32.2 | 179 | 35.2 | 2190.8 | 2.5 | 0.29 | 136.8 | 13.2 | 62.6 | 39.4 | 319.7 |
| Solano | 35 | 180 | 31.5 | 2025.2 | 1.5 | 0.28 | 134.3 | 14.3 | 62.3 | 41.4 | 341 |
| Egan | 38.8 | 180 | 41.2 | 2095.4 | 1.9 | 0.33 | 131.6 | 15.9 | 61.8 | 38.8 | 436.4 |
| Soren | 32.3 | 177 | 34.6 | 2102 | 2.1 | 0.3 | 119 | 15 | 63.3 | 35.2 | 397.3 |
| Mean | 34.7 | 179 | 36.3 | 2153.6 | 2 | 0.3 | 134.4 | 14.5 | 62 | 39.3 | 357.9 |
| Pr>F Variety | 0.2221 | <.0001 | <.0001 | <.0001 | <.0001 | <.0001 | <.0001 | <.0001 | <.0001 | <.0001 | <.0001 |
| Pr>F Density | <.0001 | <.0001 | 0.2867 | 0.0001 | <.0001 | 0.3515 | <.0001 | 0.393 | 0.0101 | 0.4347 | 0.7271 |
| Pr>F | 0.828 | 0.4417 | 0.288 | 0.3269 | 0.7763 | 0.6098 | 0.2025 | 0.5841 | 0.489 | 0.0676 | 0.7649 |
| Var X Den | |||||||||||
| PLNT: stand count, HD: heading date, HT: plant height, No. kernels: number of seeds, PTN: productive tiller number, YLD: yield, | |||||||||||
| PRO: protein, TWT: test weight, TKW: thousand kernel weight, FN: falling numbers | |||||||||||
| 1 Adjusted to 13% moisture | |||||||||||
| 2 Adjusted to 12% moisture | |||||||||||