
Managing Water Requirements of Spring Wheat Lines
Objective:
To assess trait adjustment of wheat lines at various water regimes
Summary:
The experiment used a split-plot design with water regime as the main plot, and the wheat lines as the subplots in four replications. The water regime treatments were: rainfed (as a check); deficit of 50% of evapotranspiration (ET) and 75ET; and irrigation termination treatments based on 100ET with final irrigation applied at flower, milk, and late milk. The six lines tested were low and high tiller alleles ((pair 1) and two pairs of confirmed absence and presence of the high grain protein gene (pairs 2 and 3)
This year resembled an average year in terms of rainfall and temperature. This is the first year where applying the final irrigation at flower did not lower yield (Fig.1). The data seem to indicate a linear trend of yield increases with the amount of irrigation applied, but yields of the irrigated treatments are not statistically different from each other (Fig. 1). The tillering pair had the highest yield and are not different from each other (Figure 2). The protein lines (pair 2) showed yield depression in the presence of high protein gene. The presence of the protein gene in Pair 3 did not show yield depression. The protein content of the lines with the presence of high protein gene showed the expected high protein (Fig. 3).
Table 1. Management information |
|||
|---|---|---|---|
| Seeding date: | 5/2/2018 | Harvest date: | 8/22/2018 |
| Julian date: | 122 | Julian date: | 234 |
| Seeding rate: | 25 plants/ft2 | Soil nutrient residual (lbs/A): | 18-7-117 (Fall, 2017) |
| Previous crop: | Barley | Nutrient fertilizer applied (lbs/A): | 150-40-80 |
| Tillage: | conventional | Insecticide: | Headline |
| Irrigation: | Variable | Herbicide | Warrior 2 |
| Soil type: | Creston silt loam | Seed treatment: | Cruiser Maxx Vibrance |
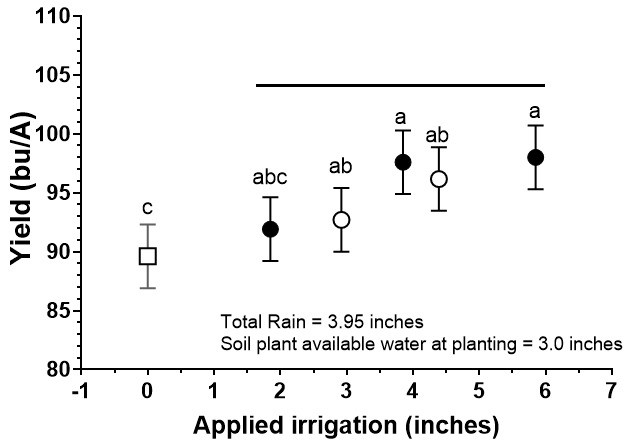
Figure 1
Yield and total irrigation applied. Solid symbols indicate (from left to right): following a 100% of evapotranspiration (ET) protocol but with final irrigation applied at flower, early milk, and medium milk stages respectively. Open symbols (from left to right) indicate the rainfed check and deficit treatments of 50ET and 75ET. The horizontal line indicates the lack of significant difference among the watering treatments.
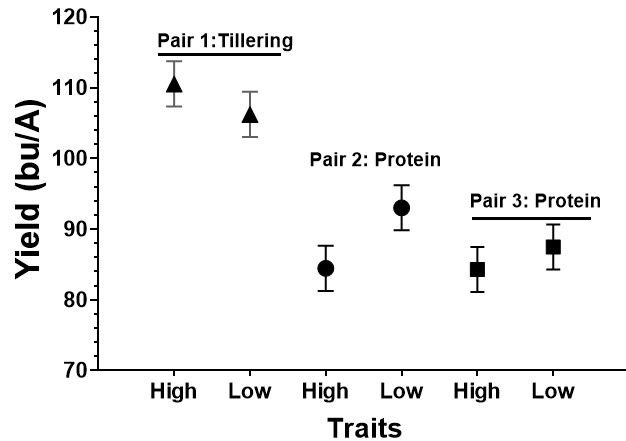
Figure 2
Yields of the various near-isogenic line pairs. Horizontal lines on top of the pairings indicate a lack of significant difference between them.
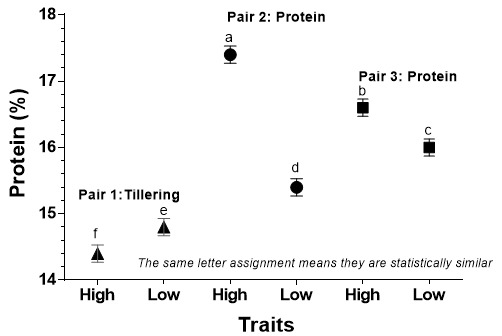
Figure 3
Protein content of the various line pairs. Different letter assignment indicates significant difference in protein levels across the lines.