
Phosphorus and Potassium Fertilization of Dormant to Semi-Dormant Alfalfa
Link to Phosphorus and Potassium Fertilization of Dormant to Semi-Dormant Alfalfa Printable PDF
Montana Fertilizer Advisory Committee (MFAC)
Objective:
To evaluate the performance of alfalfa varieties with differing P and K fertility in rainfed and irrigated environments.
Personnel:
J.A. Torrion, Amanda Shine, Eeusha Nafi, Maryse Bourgault, Emily Meccage, Peggy Lamb
Summary:
This experiment was carried out on May 2019 and continued in 2020 under three environments: 1) rainfed in Creston, 2) irrigated in Creston, and 3) rainfed in Havre. Tables 1 and 2 specify management information for Creston and Havre sites, respectively. Five rates of different phosphorus (P) and potassium (K) fertilization combinations were applied (Table 3) as the main plot factor. Six alfalfa varieties of varying fall dormancy (FD) ratings were used as the subplot factor (Table 4). Soil residual K level at Havre was initially high, thus no supplemental K was applied in 2019. Urea was added to all plots in an amount equal to that of the N present in the monoammonium phosphate used for P fertilizer.
The overall mean yield (cumulative 1st, 2nd, and 3rd cuttings) of irrigated environment was 36% greater than the rainfed environment in Creston. This year we had environment and fertility level interaction for total yield in Creston (Figure 1) and forage P and K content (Figure 3). No significant difference among the fertility levels were found under irrigated environment. Whereas, under rainfed environment, 1-1 and 1-0.5, P-K (lbs/A) fertility levels showed has higher yield compared with the rest of the treatments. Overall, forage P and K content was relatively higher under irrigated environment compared with rainfed environment for all the treatments except 1-0.5, P-K (lbs/A) fertility level (Figure 3). Higher forage P content was found for the 1-1, P-K (lbs/A) fertility level under both environments while, 0-1 and 1-1, P-K (lbs/A) fertility levels had the higher forage K content.
In Creston, we found a significant variety effect (fall dormancy, FD, Figure 2) on total yield, and % P and crude protein (CP) in forage. Among the varieties, Cisco (FD 6) had the highest total yield while, rest of the varieties showed similar yield pattern. The highest forage CP and P was found in Maxi-Graze (2).
No effects of variety or fall dormancy on yield or forage quality was found in Havre. Fertility levels affected total yield and forage P content in Havre (Figure 4). 1-0.5, P-K (lbs/A) showed the highest forage yield compared with the other fertility levels. Higher forage P content was found when both P and K were applied.
Table 1. Management information, Creston, MT |
|||
|---|---|---|---|
| Seeding date: | 5/22/19 | Field: | R8 |
| Emergence: | 5/29/19 | 2020 cutting dates: | June 23-26 |
| Seed Treatment: | Apron XL + pre-treat | July 29-Aug 3 | |
| Sept 9-Oct. 8 | |||
| Seeding rate: | 30 plants/ft2 | ||
| Previous crop: | Barley | Soil type: | Fine sandy loam |
| Herbicide: | Raptor (6/18/2019) | Tillage: | Conventional |
| Insecticide: | None | Soil residual nutrient (NO3-1, P, K lb/A): | 22-15-19 (spring 2019) |
| Fungicide: | None | Inoculant: | PreVail (Verdesian) |
Table 2. Management information, Havre, MT |
|||
|---|---|---|---|
| Seeding date: | 5/15/2019 | Field: | H |
| Emergence: | 5/25/2019 | Previous crop: | Pea/barley forage mix |
| Seed Treatment: | Apron XL + pre-treat | 2020 cutting dates: | June 19-20 |
| 30-Jul | |||
| Seeding rate: | 30 plants/ft2 | Julian date: | 214 |
| Previous crop: | Pea/barley forage mix | Soil type: | Clay loam |
| Herbicide: | None | Tillage: | No-till |
| Insecticide: | None | Soil residual nutrient: NO3-1, P, K (lb/A): | 50-11-319 (2019) |
| Fungicide: | None | Inoculant: | PreVail (Verdesian) |
Table 3. Nutrients applied in 2019 |
||||||||
|---|---|---|---|---|---|---|---|---|
| ID | P205 rates | K2O rates | Creston | Havre | ||||
| ---------------------------------------lbs/A---------------------------------------------- | ||||||||
| P2O5 | K2O | N | P2O5 | K2O | N | |||
| 1 | 0 | 0 | 0 | 0 | 8.5 | 0 | 0 | 12.7 |
| 2 | 0 | 1 | 0 | 170 | 8.5 | 0 | 0 | 12.7 |
| 3 | 0 | 0.5 | 0 | 85 | 8.5 | 0 | 0 | 12.7 |
| 4 | 1 | 1 | 40 | 170 | 8.5 | 60 | 0 | 12.7 |
| 5 | 1 | 0.5 | 40 | 85 | 8.5 | 60 | 0 | 12.7 |
Table 4. Alfalfa varieties used in the study |
|
|---|---|
| Varieties | Fall dormancy |
| Maxi-Graze | 2 |
| Rugged | 3 |
| Alphatron | 4 |
| Saltiva | 5 |
| Cisco II | 6 |
| Magna | 7 |
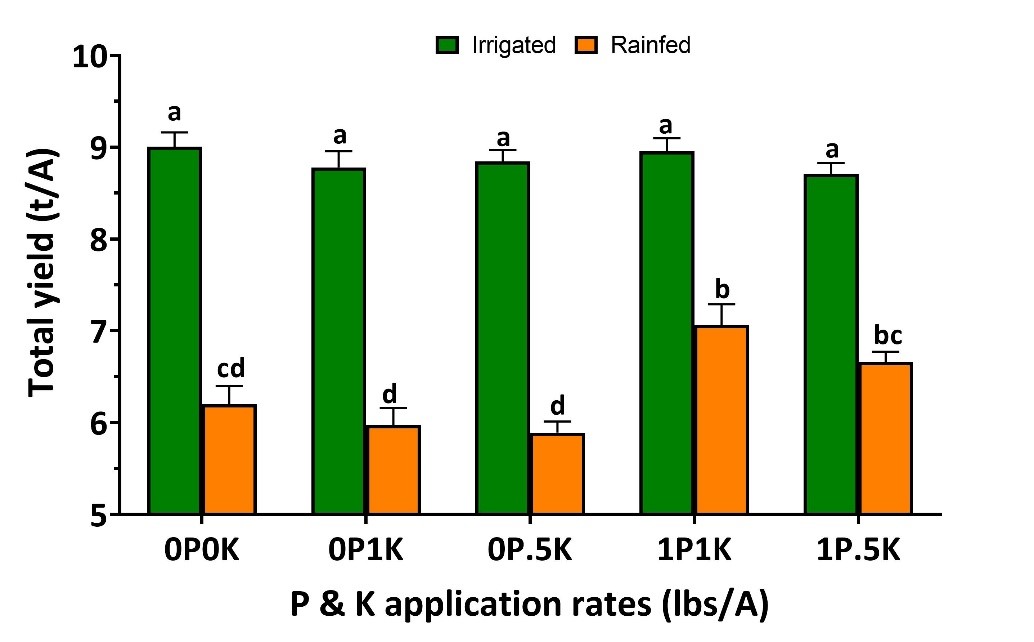
Figure 1.
Total yields (3 cuttings) with fertility levels at Creston, MT. Same letter assignment denotes no statistical difference (α = 0.05).
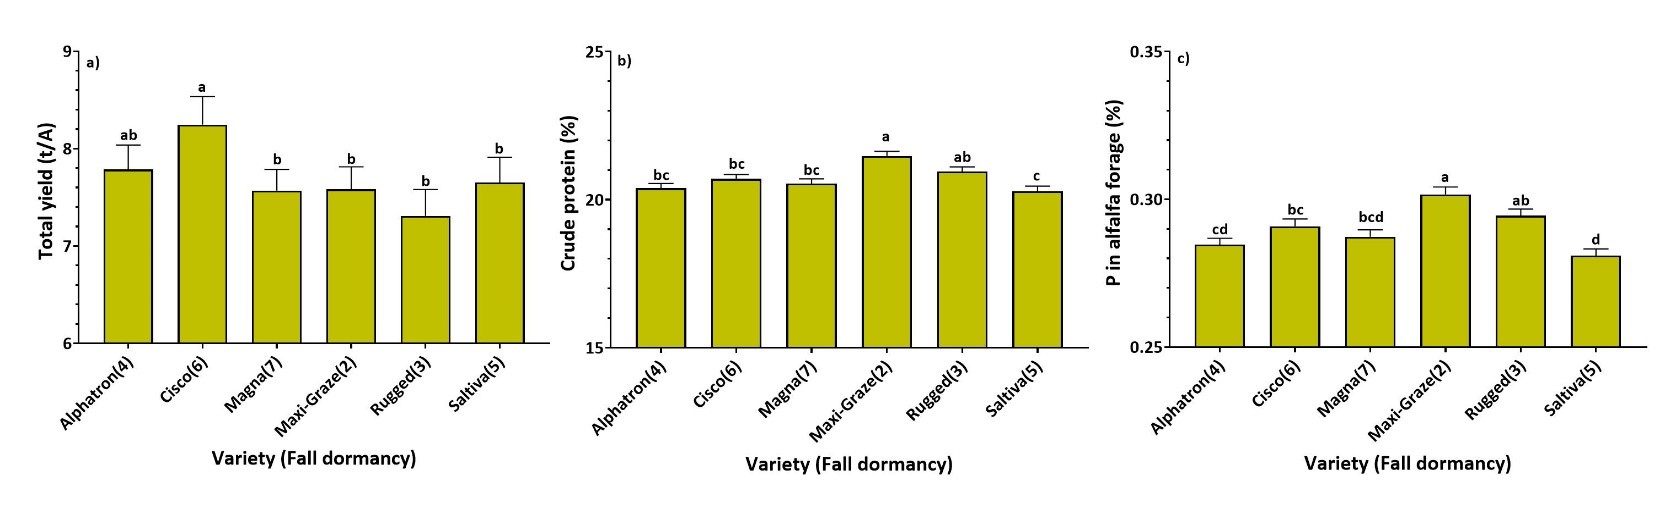
Figure 2.
Total yields (a), forage crude protein (b), and P (c) with variety (fall dormancy) at Creston, MT. Same letter assignment denotes no statistical difference (α = 0.05).
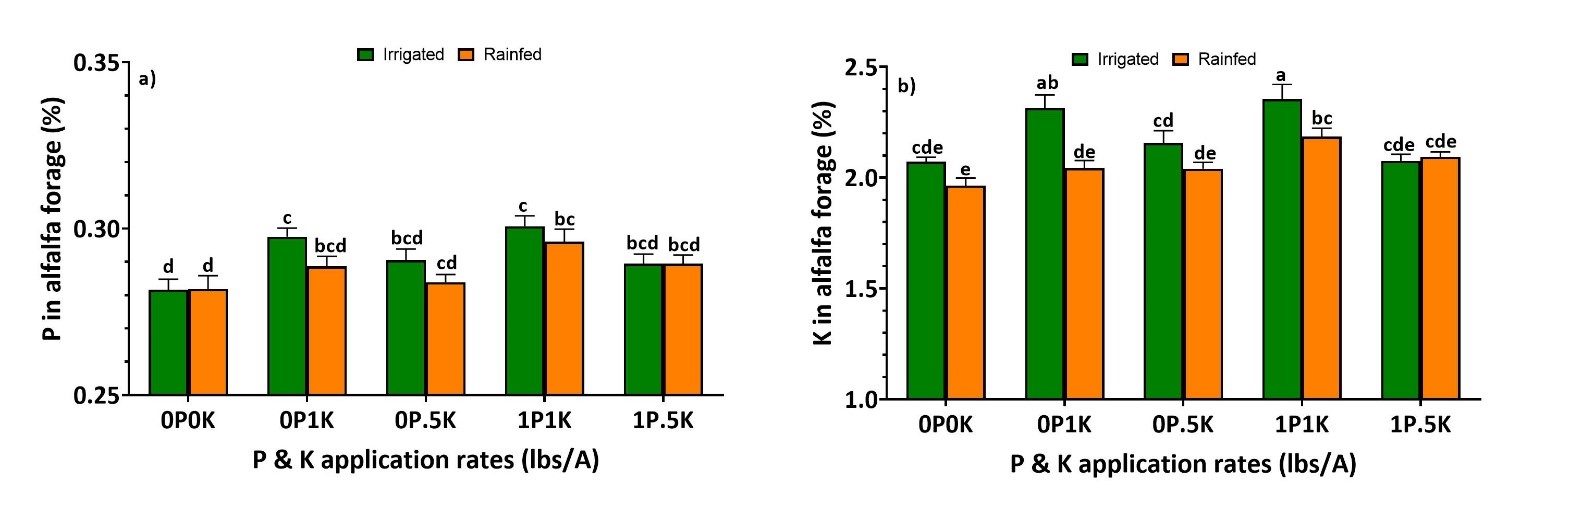
Figure 3.
Forage P (a), and K (b) content with fertility levels at Creston, MT. Same letter assignment denotes no statistical difference (α = 0.05).
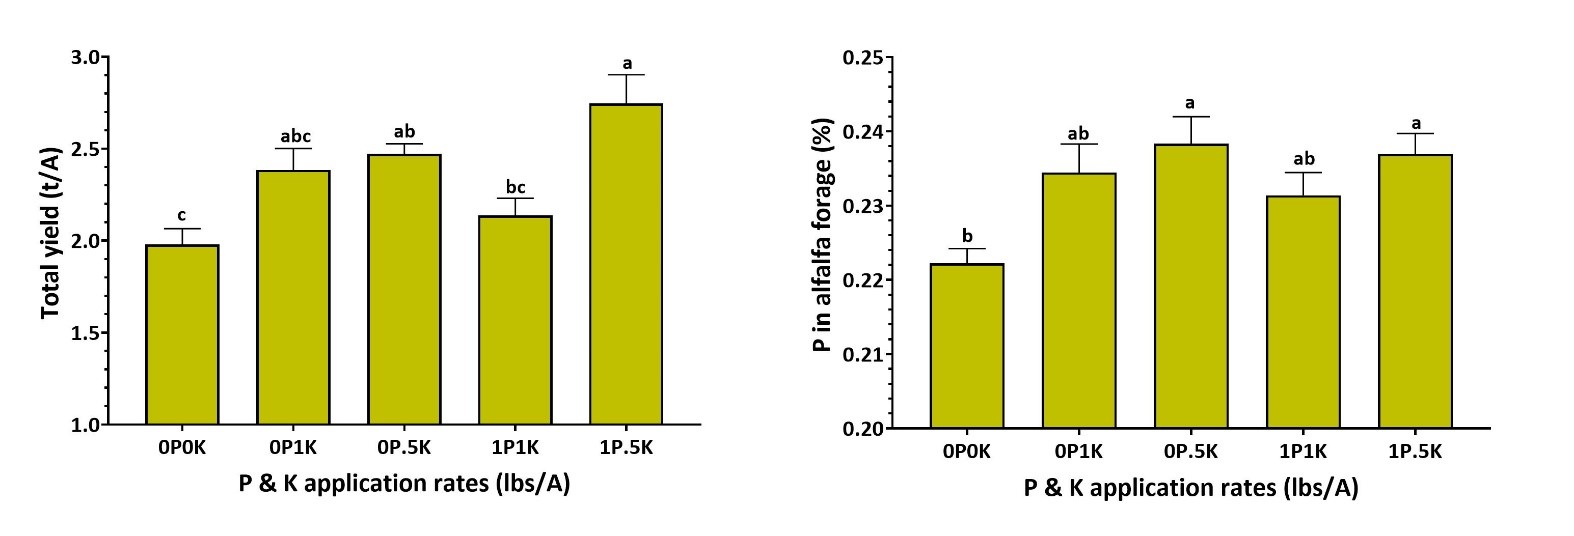
Figure 4.
Forage total yield (a), and P content (b) with fertility levels at Havre, MT. Same letter assignment denotes no statistical difference (α = 0.05).