
Determining Optimal Nitrogen Fertilization of Selected Warm Season Grasses for Yield and Quality
Objective:
To evaluate the nitrogen response of seven warm season grasses under different levels of nitrogen fertility and contrasting moisture regimes
Personnel:
Jessica A. Torrion, Amanda Shine, Eeusha Nafi
Summary:
This trial was planted on May 28-29, 2020. Specific management information is provided in Table 1. Five different nitrogen (N) fertilization treatments were applied (Table 2) as the main plot factor with seven grass species (Table 3) as the sub-plot factor. The study was duplicated under two moisture regime environments: rainfed and irrigated. A total 5.8 inches of water was applied under the irrigated environment. The rainfed environment received a total of 6.7 inches of rainfall.
As expected, greater forage yield was attained under irrigated condition (6.2 t/A) compared with rainfed condition (4.1 t/A). Forage yield did not increase with total N levels (Figure 1) due to the high initial soil nitrate residuals and the previous crop alfalfa credit. Forage yield averaged 5.1 t/A, ranging from 7.8 t/A for sorghum-sudan grass to 3.4 t/A for teff grass. Although forage yield was significantly lower under rainfed condition, yield patterns were similar under both environments for the grass species (Figure 2).
Grass crude protein content interacted with species and environment (Figure 3) where Tiffleaf 3 had the highest crude protein when planted under rainfed. Crude protein content averaged 15.3% and ranged from 9.8% for sorghum-sudan grass to 18.4% for teff grass species. Further, crude protein content followed similar pattern in either environments. Forage nitrate content increased with increased nitrogen levels and irrigation application. Irrigation application resulted in increased nitrogen availability (greater uptake) to the plants (Figure 4). Although pearl millet had the highest forage nitrate content (2575 ppm), sorghum-sudan grass species also had a significant amount of forage nitrate content compared other species. Sudangrass had the lowest forage nitrate content (751 ppm) among other species (data not shown).
Table 1. Management information |
|||
|---|---|---|---|
| Seeding date: | 5/28/2020 | Field Location: | R5 |
| Seeding rate: | Species-dependent | Harvest date: | Species-dependent (7/28-9/29) |
| Previous crop: | Alfalfa | Soil type: | Creston Silt Loam |
| Herbicide: | Shredder | Tillage: | Conventional |
| Fertilizer applied (N, P2O5, K20 lb/A): |
Treatment N-40-80 | Soil residual nutrient (NO3-, P, K lb/A): |
78-26-37 |
Table 2. Nutrients levels in 2020. The total nitrogen (N) was the total N supply from the initial soil residual nitrates down to 2-ft depth + N from applied urea, monoammonium phosphates + N credit from previous alfalfa crop.
| Treatments | Applied N | Total N | Applied P2O5 | Applied K20 |
|---|---|---|---|---|
| ---------------------------------------lbs/A---------------------------------------------- | ||||
| N0 | 0 | 108 | 40 | 80 |
| N1 | 38 | 146 | 40 | 80 |
| N2 | 63 | 171 | 40 | 80 |
| N3 | 88 | 196 | 40 | 80 |
| N4 | 113 | 221 | 40 | 80 |
Table 3. Species, seeding rates, and entry names. Sorghum-Sudan entries are variety not stated. |
||
|---|---|---|
| Entry | Species | Seeding rate (Seeds/ft2) |
| Tifleaf 3 | Pearl Millet | 15 |
| Piper | Sudangrass | 25 |
| Corvallis | Teff | 10 |
| 20BAR_ET | Teff | 10 |
| SS_01 | Sorghum-Sudan | 25 |
| SS_02 | Sorghum-Sudan | 25 |
| SS_04 | Sorghum-Sudan | 25 |
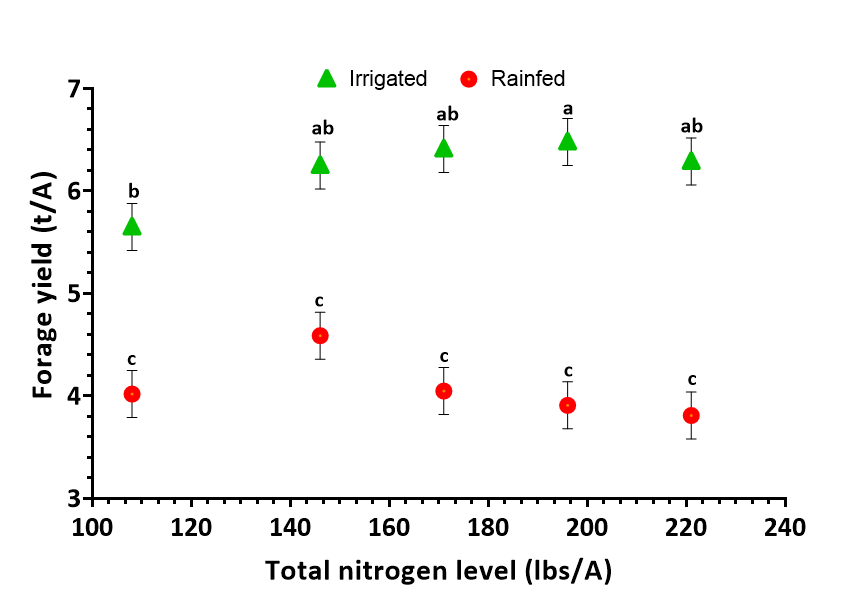
Figure 1.
Environment x total nitrogen level interaction means of forage yield (t/A). Error bars are the standard error of the difference between N supply across environments. Same letter denotes nonsignificance within environment at α= 0.05. The total nitrogen (N) was the total N supply from the initial soil residual nitrates down to 2-ft depth + N from applied from urea, monoammonium phosphates + N credit from previous alfalfa crop.
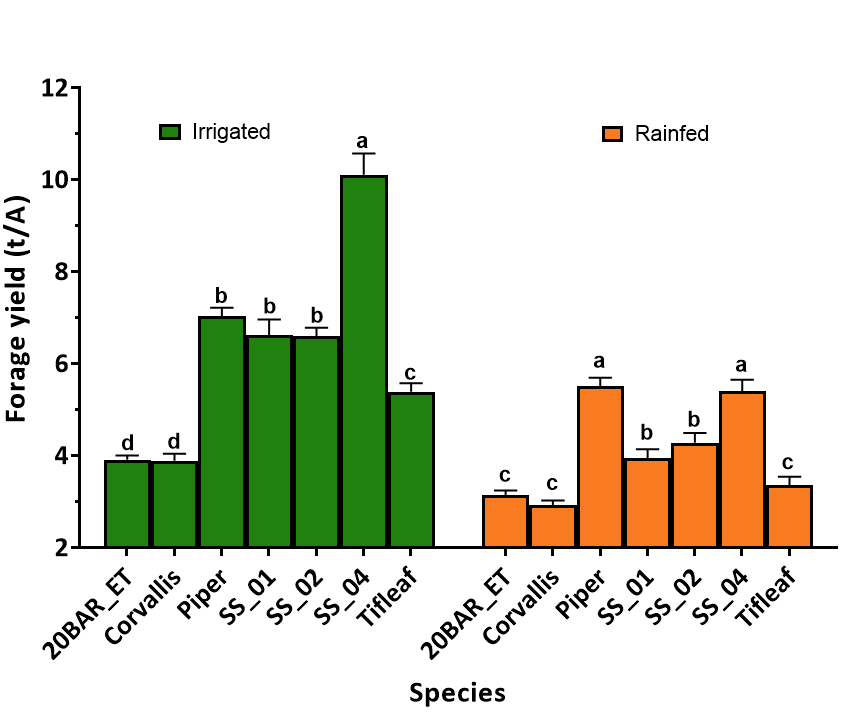
Figure 2.
Environment x species interaction means of forage yield (t/A). Error bars are the standard error of the difference between species within an environment. Same letter denotes nonsignificance within environment at α= 0.05.
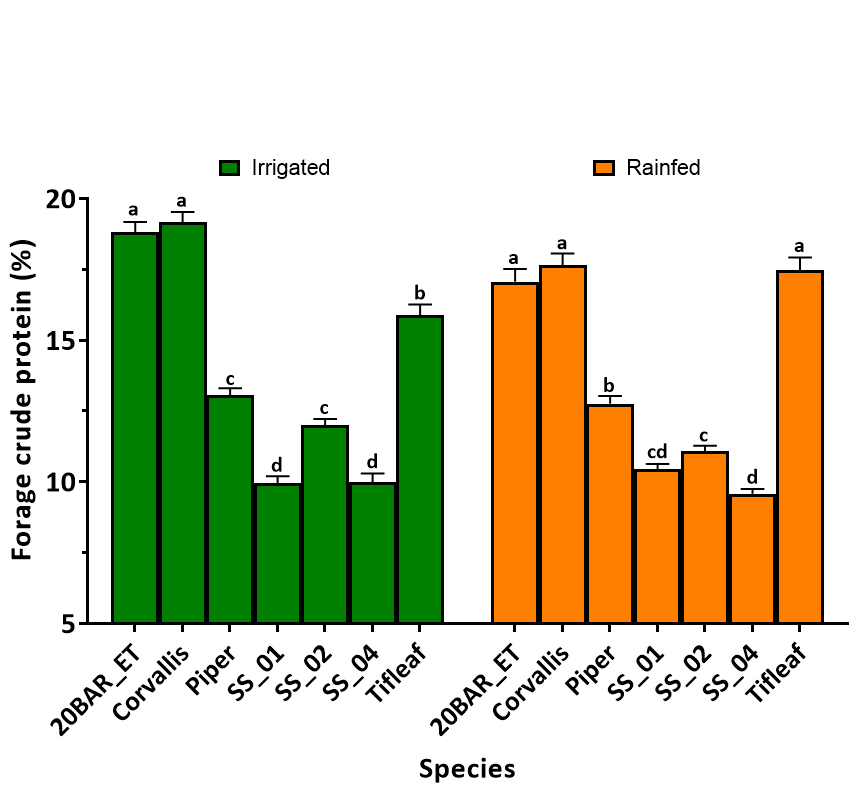
Figure 3.
Environment x species interaction means of forage crude protein content (%). Error bars are the standard error of the difference between species within an environment. Same letter denotes nonsignificance within environment at α= 0.05.
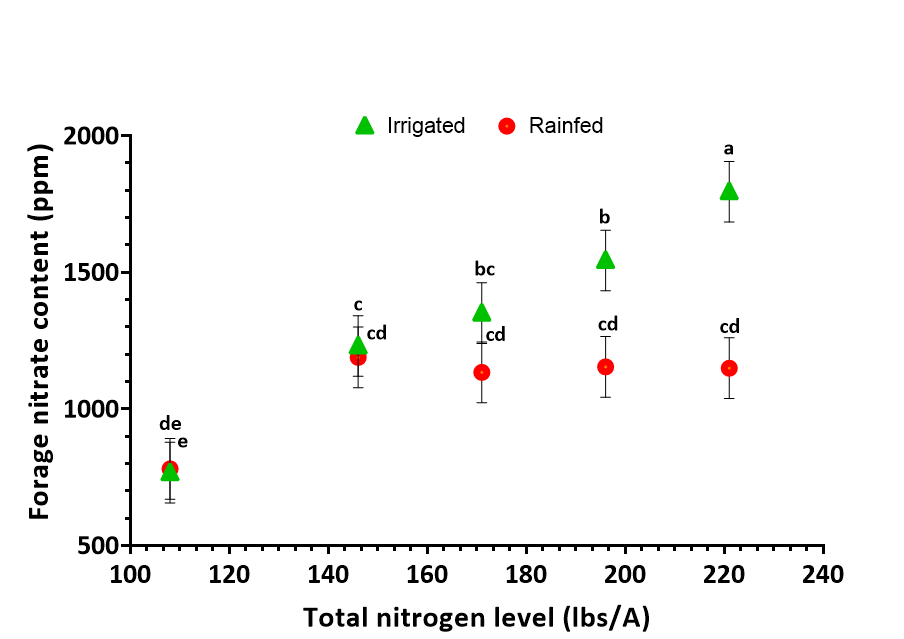
Figure 4.
Environment x total nitrogen level interaction means of forage nitrate content (ppm). Error bars are the standard error of the difference between N supply across environments. Same letter denotes nonsignificance within environment at α= 0.05. The total nitrogen (N) was the total N supply from the initial soil residual nitrates down to 2-ft depth + N from applied from urea, monoammonium phosphates + N credit from previous alfalfa crop.