
Off-Station Winter Wheat Nitrogen Management
Link to Off-Station Winter Wheat Nitrogen Management Printable PDF
Objective:
To evaluate the performance of the rates and split-application of nitrogen in rainfed winter wheat production environment in northwestern Montana
Personnel:
J.A. Torrion, Eeusha Nafi
Summary:
The off-station winter wheat nitrogen (N) trial was planted under no-till rainfed ground with row-spacing 12-in apart on Sept. 23, 2019. See Table 1 for detailed management information.
The nitrogen rates applied were: 1) 0 as control, 2) 40, 3) 80, 4) 80 split-applied, 5) 120, and 6) 120 split-applied lbs N/A. Urea was used as an N fertilizer source. The soil had a 25 lbs/A residual nitrate and 10 lbs N drilled with the seeds at planting.
The highest yield response was recorded at the 120 lbs/A rate at either N-applied in early spring or split (early spring + heading). There were no significant differences in yield between these two treatments. There was also no statistical yield difference between the 80 lbs/A N application in the spring or split in the spring + heading application. We observed a similar trend in the grain protein (Figure 2) as the grain yield with N application rates. The plant height, test weights, and the falling number increased at 80 lbs/N and plateaued after that (data not presented).
In the spring, this nursery received 9.7 inches of rain.
Table 1. Management Information |
|||
|---|---|---|---|
| Seeding date: | 9/23/2019 | Field Location: | Big Mahugh |
| Julian date: | 267 | Harvest date: | Aug. 3, 2020 |
| Seeding rate: | 90 lbs/A | Julian date: | 216 |
| Previous crop: | Peas | Soil type: | Flathead very fine sandy loam |
| Herbicide: | 5/5: Beyond | Tillage: | No-till |
| Variety: | Brawl CL | ||
| Insecticide: | None |
Soil residual nutrient (NO3-, P, K lb/A): |
25-18-172 |
| Fungicide: | None |
Nutrient fertilizer applied (N, P2O5, K20 lb/A): |
10-35-45 (10 S, 1 Zn) - drilled N applied varied, see N treatment |
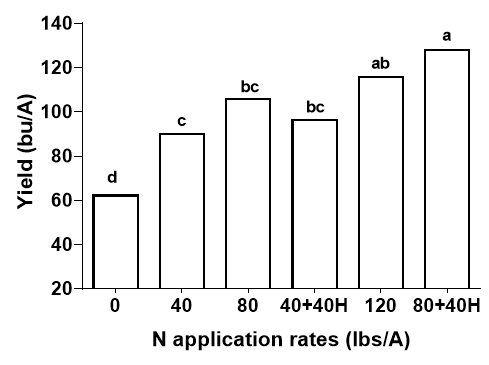
Figure 1.
Yield response to nitrogen (N) application rates and timing (split-applied at heading). The first application was in early spring. The split (second) application is indicated by a ‘+’ sign and H (at Heading). The application rates specified did not include the residual N (25 lbs/A) and the amount drilled with the seeds (10 lbs/A). The same letter assignment indicates nonsignificance at P<.05.
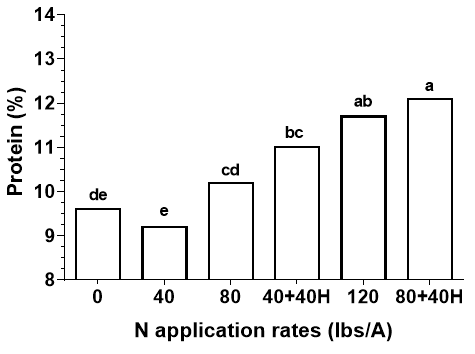
Figure 2.
Protein response to nitrogen (N) application rates and timing (split-applied at heading). The first application was in early spring. The split (second) application is indicated by a ‘+’ sign and H (at Heading). The application rates specified did not include the residual N (25 lbs/A) and the amount drilled with the seeds (10 lbs/A). The same letter assignment indicates nonsignificance at P<.05.