Objective:
To evaluate the effect of planting date and maturity group on soybean grain yield and quality in northwestern Montana
Personnel:
J.A. Torrion, E. Nafi
Summary:
Five different maturity groups (MG) of soybeans were planted on different dates, starting from late-April to late-May (Table 2) dryland conditions. Damage due to vegetative consumption by deer was observed in the late part of the season (prior to harvest, primarily) but did not contribute to the variability in yields. There was minimal lodging and shattering in the trial.
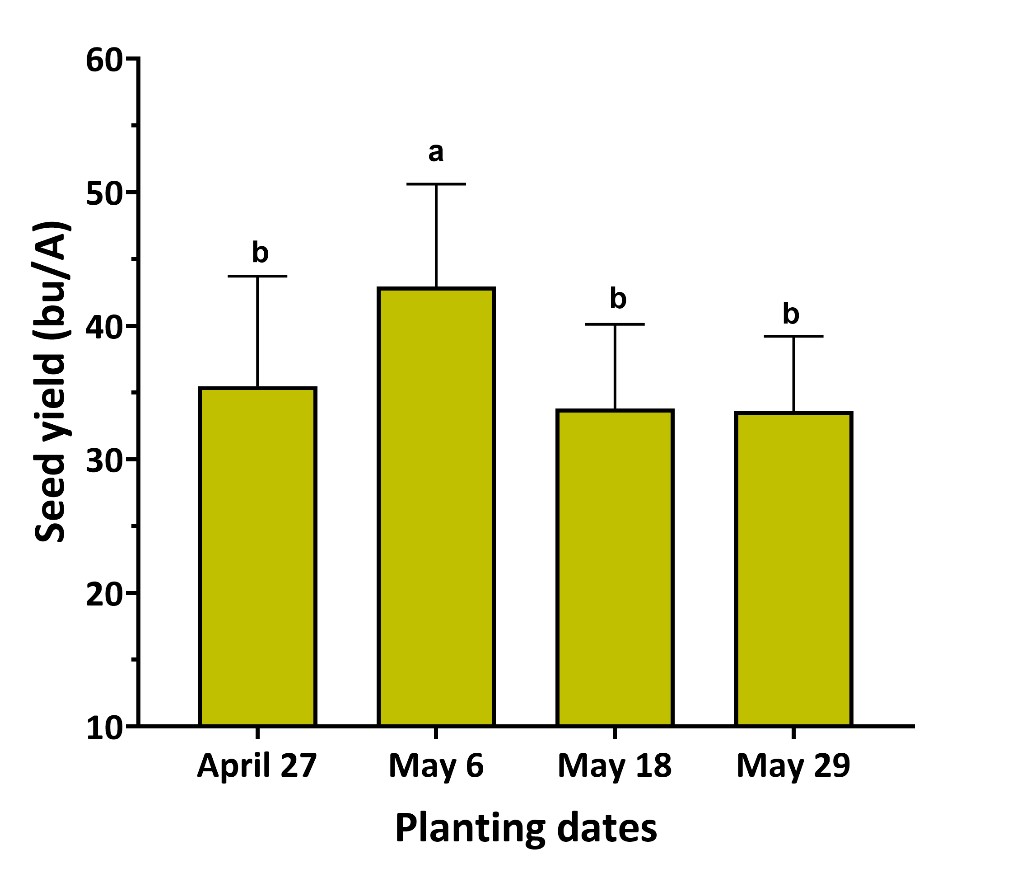
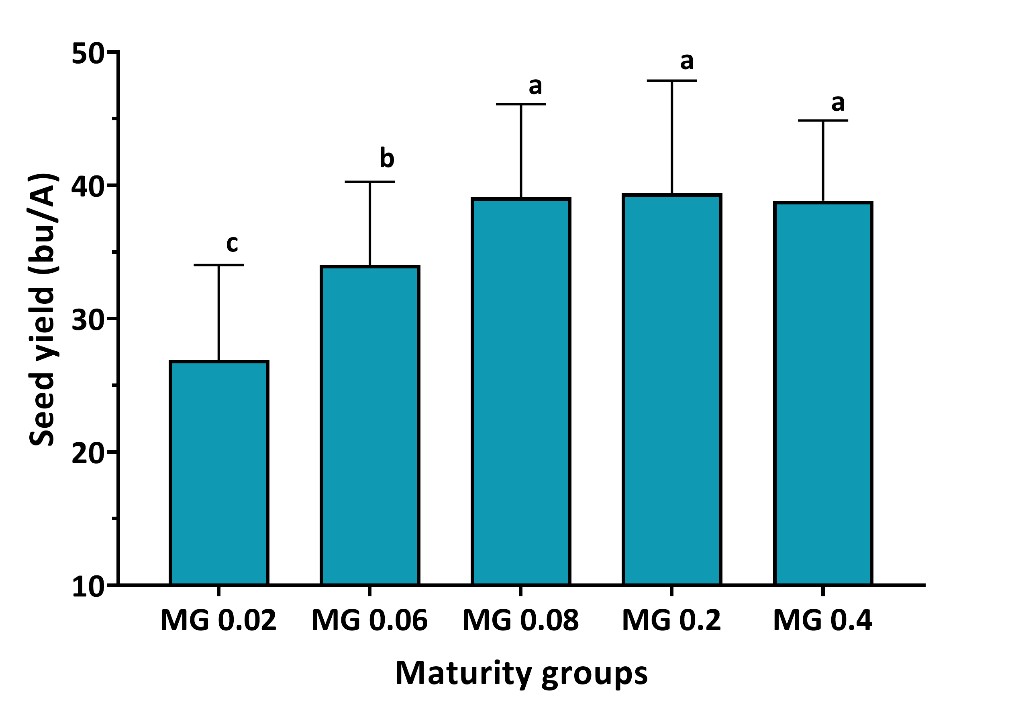
No significant interaction between planting date and MG was recorded for soybean measured traits except seed oil content. The average grain yield across the trail was 36.6 bu/A. the highest yield (42.9 bu/A) was observed when soybean was planted in May 6th and the lowest (33.6 bu/A) was recorded with delayed planting (Figure 1). The MG 0.08 had higher yields (39.0 bu/A) and increasing MG beyond 0.08 did increase yield any further (Figure 2). The caveat is that for longer MG beyond 0.08, drying down time of the pods and stems is a major concern for timely harvesting.
The highest seed protein content was observed under the delayed-planted and early maturing soybean varieties (Table 3). As planting was delayed, thousand kernel weight (TKW) and test weight (TWT) increased (Table 3). The lowest TKW (34.5 g) and TWT (57.3 lbs/bu) was found for early-planted soybean. The average TKW and TWT were 35.8 g and 57.7 lbs/bu, respectively. Late maturing soybean varieties also showed the greatest TKW (except 0.4) and TWT compared with the early maturing ones (Table 4). Seed oil content topped out at 22.1% for early-planted soybean, and decreased as planting was delayed. Oil content was inconsistent with the maturity groups, ranging from 20.7% to 21.9%.
Table 1. Management information |
|||
| Seeding rate (plants/acre): | 150,000 | Field location: | X1 |
| Previous crop: | Corn | Soil type: | Creston silt loam |
| Herbicide: | 6/3: Basagran | Tillage: | Conventional |
| Insecticide: | None |
Soil residual nutrient: |
(NO3-, P, K lb/A): 190-12-258 |
| Fungicide: | None | Nutrient fertilizer applied: | (N, P2O5, K20 lb/A): 0-30-0 |
| Inoculant: | Verdesian N-Dure | ||
Table 2. Harvesting dates of the respective soybean planting dates |
|
| Planting dates | Harvesting dates |
| 27-Apr | 2-Oct |
| 6-May | 2-Oct |
| 18-May | 8-Oct |
| 29-May | 8-Oct |
Table 3. Planting date (individual) effects on soybean quality |
||||
| Planting dates | Protein | TKW | TWT | Oil |
| (%) | (g.) | (lbs/bu) | (%) | |
| 27-Apr | 37.1b | 34.5b | 57.3b | 22.1a |
| 6-May | 36.9b | 35.5b | 57.8ab | 21.2b |
| 18-May | 38.2a | 34.9b | 58.2a | 20.7c |
| 29-May | 38.3a | 36.6a | 58.0a | 20.6c |
| Mean | 37.6 | 35.6 | 57.8 | 21.2 |
| CV% | 4.8 | 11.9 | 1.9 | 4.8 |
| Pr > F | 0.006 | 0.04 | 0.02 | <0.001 |
TWT= test weight, TKW = thousand kernel weight
Table 4. Maturity group (individual) effects on soybean quality |
||||
| Maturity groups | Protein | TKW | TWT | Oil |
| (%) | (g.) | (lbs/bu) | (%) | |
| 0.02 | 39.9a | 33.8bc | 57.4ab | 20.7c |
| 0.06 | 37.9b | 36ab | 57.3b | 21.9a |
| 0.08 | 37.2bc | 35.9ab | 57.9a | 21.1bc |
| 0.2 | 36.8bc | 38.7a | 57.8ab | 21.3b |
| 0.4 | 37.1c | 32.4c | 58.4a | 20.7c |
| Mean | 37.8 | 35.4 | 57.7 | 21.3 |
| CV% | 4.5 | 10.8 | 1.8 | 4.7 |
| Pr > F | <0.001 | <0.001 | 0.02 | 0.0008 |
TWT= test weight, TKW = thousand kernel weight

Figure 1.
Soybean seed yield with planting dates. Same letter assignment denotes no statistical difference (α = 0.05).

Figure 2.
Soybean seed yield with maturity groups. Same letter assignment denotes no statistical difference (α = 0.05).
