
Objective:
To determine optimal nitrogen input levels for malt barley lines in Montana
Personnel:
Clint Beiermann,Jamie Sherman, Kent McVay, Jessica Pavelka
Summary:
Five varieties of malt barley were planted on May 14th, 2021 at the Western Triangle Agricultural Research Center. They were managed under rainfed conditions, and harvested on September 9th, 2021 (Table 1).
Four nitrogen rates were evaluated 108, 120, 180, and 240 lb/A in combination with five varieties of malt barley. There was not a significant effect of nitrogen rate on yield. Yields ranged from 41.1 bu/A to 45.8 bu/A across varying nitrogen treatments (Table 2). Nitrogen rate had a significant effect on grain protein. The nitrogen rates of 180 and 240 lbs/A had higher protein levels of 13.4 and 13.7%, respectively (Table 2). All barley varieties exhibited an increase in grain protein with increasing nitrogen levels (Figure 1). Buzz and MT16M02201 performed similarly in protein level response to increasing nitrogen and had the lowest protein levels across the four nitrogen treatments, which is a desirable trait in malt barley (Figure 1).
Barley variety had a significant effect on yield, test weight, and grain protein. The highest yielding variety across nitrogen levels was Buzz at 51.8 bu/A followed by MT16M02201 at 44.8 bu/A (Table 3). The highest test weights were 48.5 lb/bu from Hockett, 48.3 lb/bu for Buzz, and 47.9 lb/bu for MT16M05610. The highest grain protein was 13.8% from both MT16M05610 and Hockett. The lowest average protein was 12.6% for Buzz and 12.7% for MT16M02201 (Table 3).
Table 1. Management information |
|||
|---|---|---|---|
| Seeding date: | 5/14/2021 | Field Location: | Western Triangle |
| Julian date: | 135 | Harvest date: | 9/9/2021 |
| Seeding rate: | Dependent on Variety | Julian date: | 252 |
| Previous crop: | Fallow | Soil type: | Clay loam |
| Herbicide: | Axial Bold / CleansweepM 5/6/2021 | Tillage: | No-till |
| Insecticide: | None | Soil residual N (lbs/A) | 108 |
| Fungicide: | None | N rates applied (lbs/A) | 120, 180, 240 |
Table 2. Agronomic performance based on nitrogen rate applied |
|||
|---|---|---|---|
| N Rate | Yield | Test Weight | Protein |
| lb N/A | (bu/A) | (lb/bu) | (%) |
| 108 | 43.8 | 43.8 | 12.9 |
| 120 | 44.2 | 44.2 | 12.9 |
| 180 | 45.8 | 45.8 | 13.4 |
| 240 | 41.1 | 41.1 | 13.7 |
| LSD (0.05) | NA | NA | 0.32 |
| Bolding denotes equal value to highest or earliest value within a column based on LSD (α=0.05) | |||
Table 3. Agronomic performance of the varieties |
|||
|---|---|---|---|
| Variety/Line | Yield | Test Weight | Protein |
| (bu/A) | (lb/bu) | (%) | |
| Buzz | 51.8 | 48.3 | 12.6 |
| MT16M01902 | 42.6 | 45.7 | 13.2 |
| MT16M02201 | 44.8 | 46.7 | 12.7 |
| MT16M05610 | 35.8 | 47.9 | 13.8 |
| Hockett | 43.7 | 48.5 | 13.8 |
| LSD (.05) | 7.33 | 1.06 | 0.35 |
| Bolding denotes equal value to highest or earliest value within a column based on LSD (α=0.05) | |||
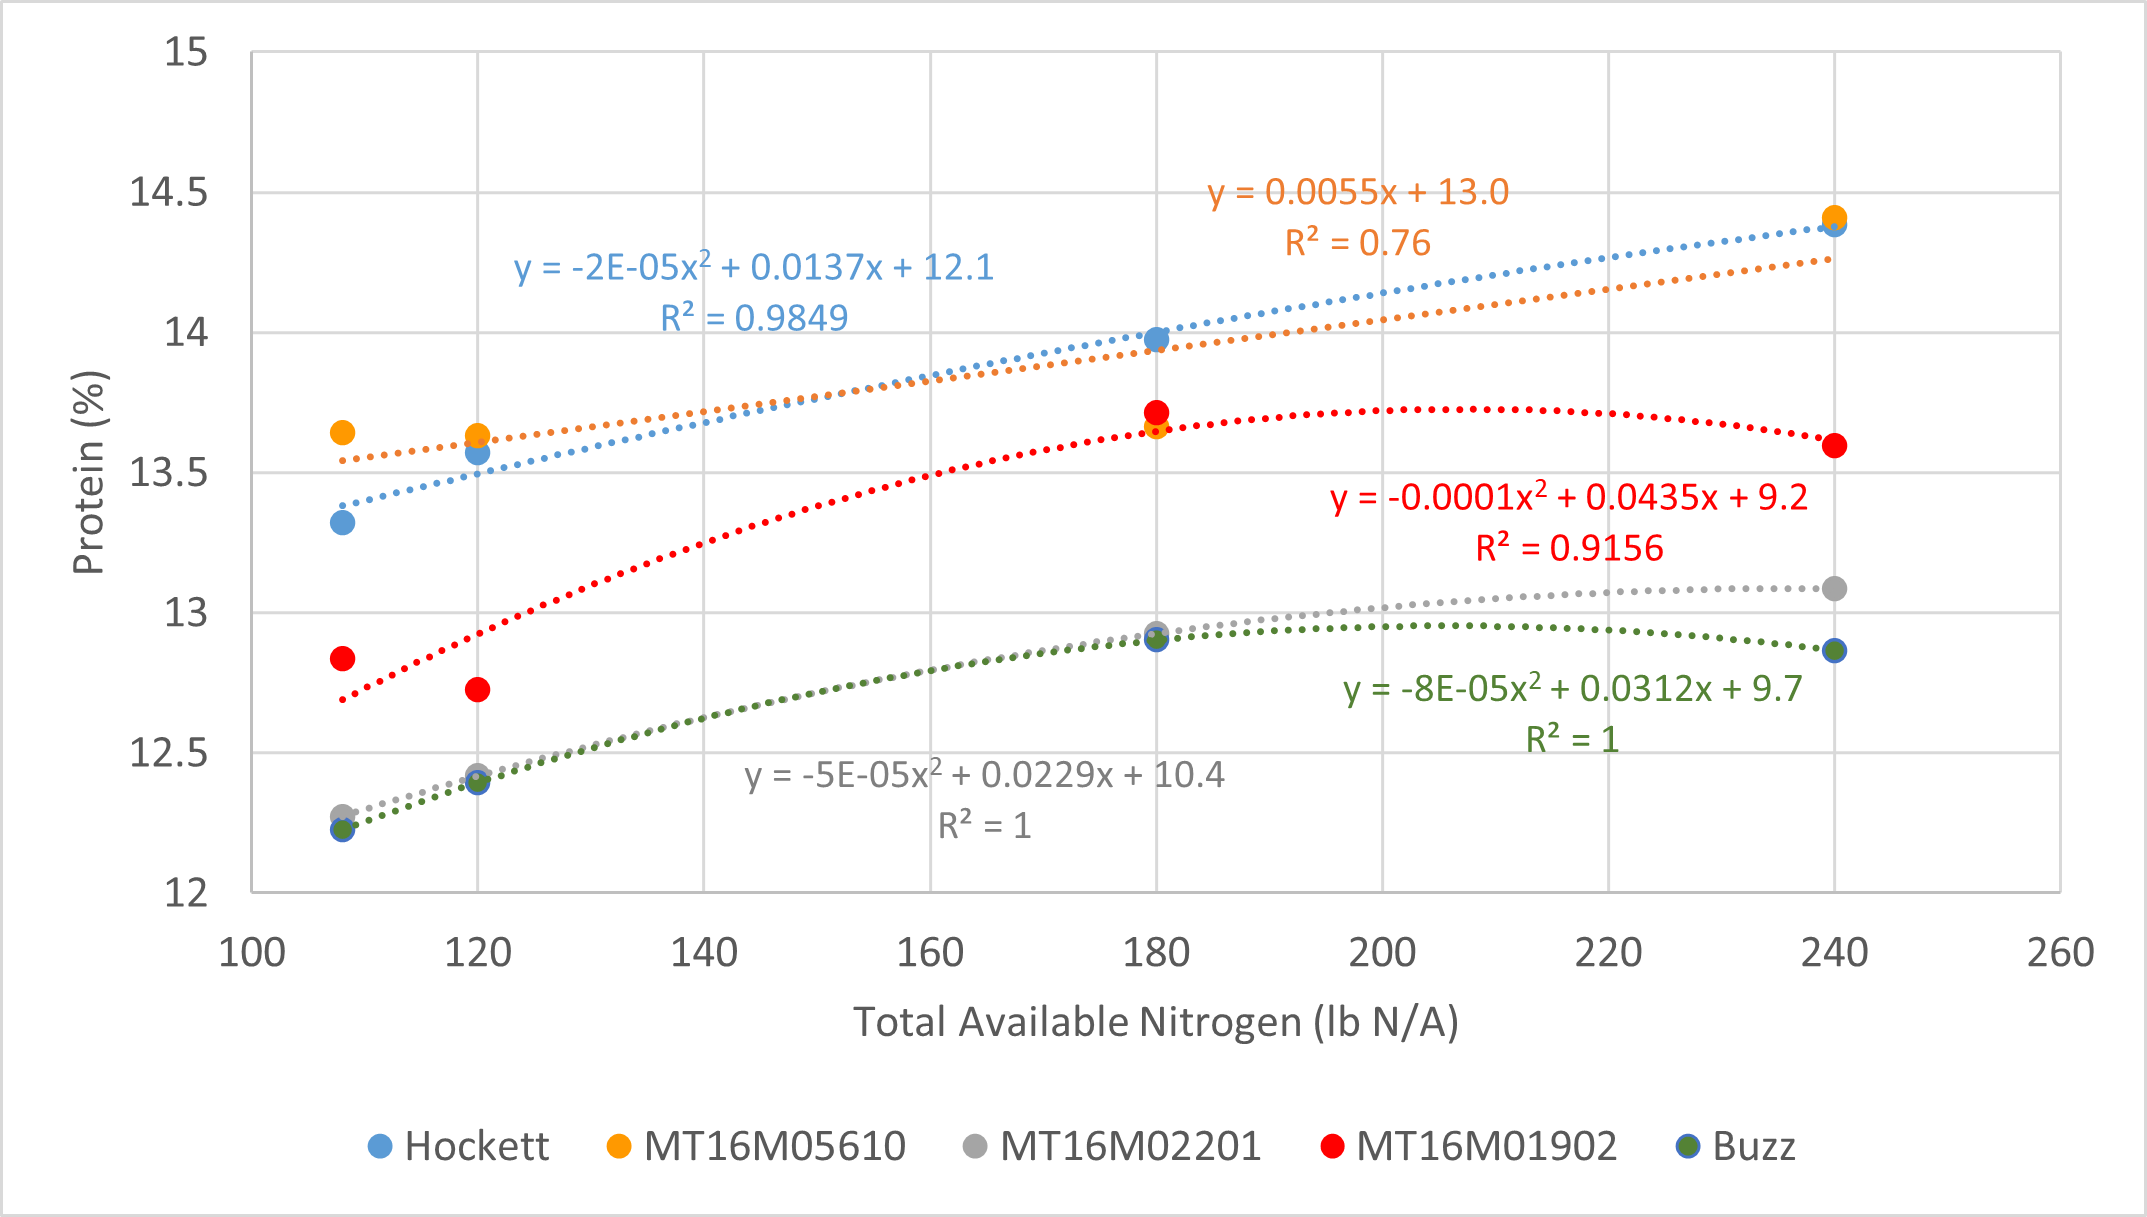
Figure 1
Protein response by variety across nitrogen levels