
Alfalfa Planting Density Study (3rd Year of Establishment)
Link to Alfalfa Planting Density Study (3rd Year of Establishment) Printable PDF
Objective:
To test different planting densities on yield and persistence over three growing seasons for alfalfa varieties.
Personnel:
J.A. Torrion, Eeusha Nafi, Daniel Porter
Summary:
The alfalfa planting density trial was evaluated from 2019 through 2021. Alfalfa (variety = Rugged) was planted at five different densities to assess the impact of plant density on yield and persistence over three growing seasons. We conducted this trial under rainfed conditions on fine sandy loam soil. 2021 was the third year of its establishment, with three cutting events on 6/24, 7/19, and 8/26.
In 2021, there were no significant forage yield differences among the various planting densities (Figure 1a), similar to the forage yields in 2019 and 2020. We also presented the three-year forage yield with no significant difference (Figure 1b). In 2021, the number of plants ranged from 11.5 to 14 plants/ft2, but insignificant (Figure 2a). There was an average of 60 plants/ft2 across planting density, and the variations were negligible (Figure 2b). Thus, for rainfed alfalfa (as this study), a producer can save seed technology costs if planting alfalfa conservatively.
Table 1. Management Information |
|||
| Seeding date: | 5/23/2019 | Field Location: | R8 |
| Julian date: | 143 | Harvest date: | 6/24, 7/19, 8/26 (2021) |
| Seeding rate: | See Treatments | Julian date: | 175, 200, 238 |
| Previous crop: | Barley | Soil type: | Fine Sandy Loam |
| Herbicide: | Raptor 6oz/A (6/18/2019) | Tillage: | Conventional |
| Insecticide: | None | Soil residual nutrient (NO3-, P, K lb/A): | 22-15-19 (Spring, 2019) |
| Fungicide: | None | Nutrient fertilizer applied (N, P2O5, K2O lb/A): | 21-60-100-10(S) (Spring, 2019) |
Table 2. Planting density treatments |
||
| Treatment | Plant Density (plants/ft2) | lbs/A PLS* |
| 1 | 16/ft2 | 4 |
| 2 | 24/ft2 | 6 |
| 3 | 36/ft2 | 9 |
| 4 | 48/ft2 | 12 |
| 5 | 60/ft2 | 15 |
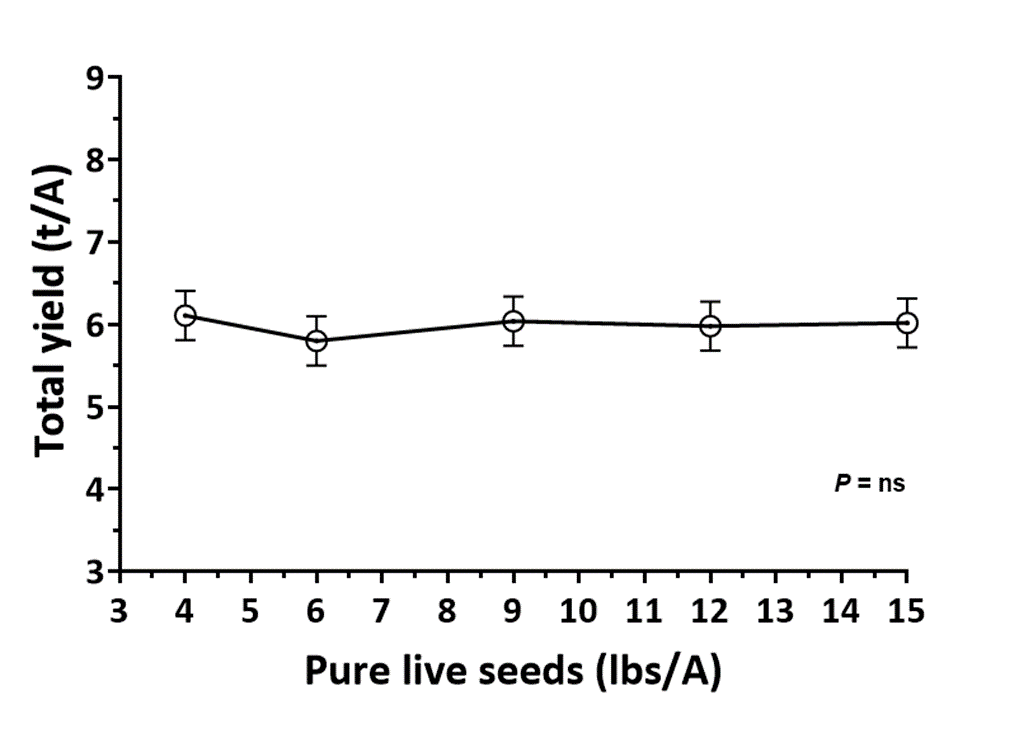
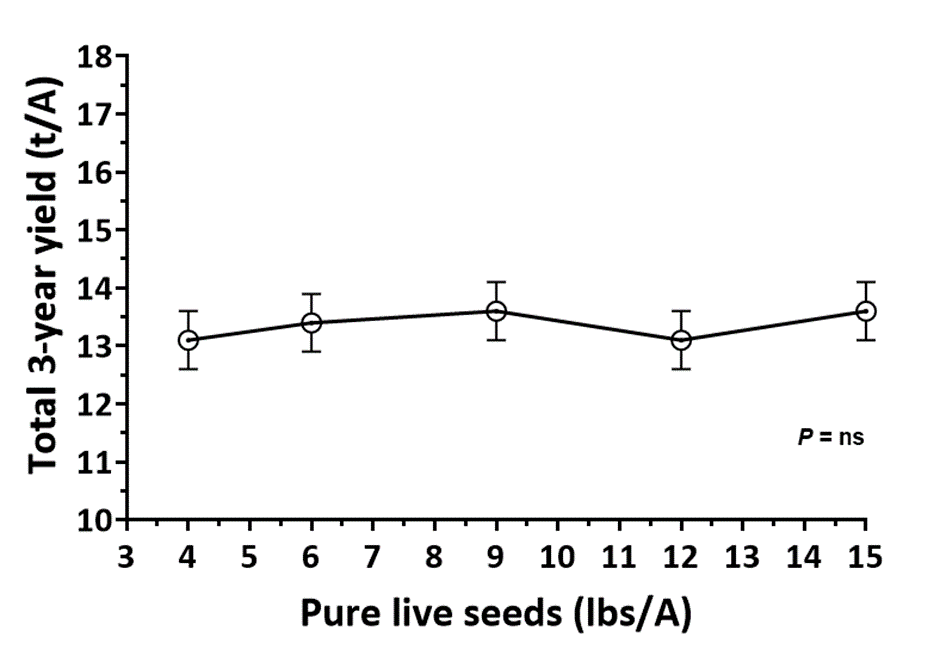
Figure 1. 2021 a) dry forage yield across seeding densities (b) and the total three year-yield (2019-2021) across seeding densities. p value ns (not significant).
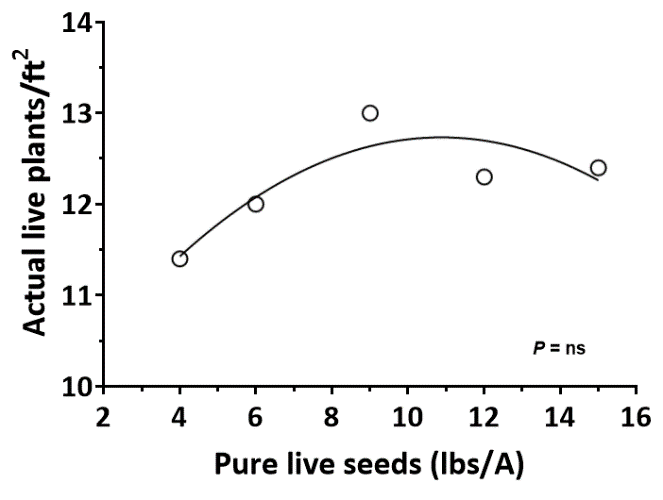
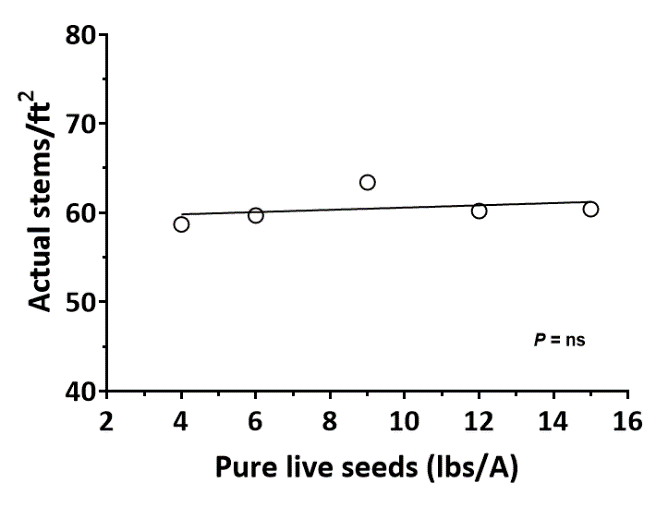
Figure 2. 2021 end of the season (a) live plant count and (b) an actual number of stems per area. p value ns (not significant).