Objective:
To evaluate the agronomic performance of forage barley with different nitrogen fertilizer rates in environments and cropping systems representative of northwestern Montana
Personnel:
Clint Beiermann,Jessica Pavelka
Summary:
Forage barley was planted on April 29th, 2022 with four different nitrogen rates of 47, 114, 182, and 249 lbs/A (Table 1), and five different varieties (Table 2).
N rates had an influence on all aspects tested. Variety influenced the ADF %, NDF %, heading date, heading height, grain yield, grain protein, and test weight. The highest yielding variety was MT16F01601 at 182 lbs/A N, while the lowest averaging forage yield came from the five varieties given 47 lbs/A N. The lowest forage yield came from MT17M02507 at 182 lbs/A N, although it had the highest grian yield at 106.7 bu/A. The highest grain protein was 14.5% in Cowgirl at 249 lbs/A N, and the lowest was 9.3% from MT17M02507 at 47 lbs/A N (Table 2).
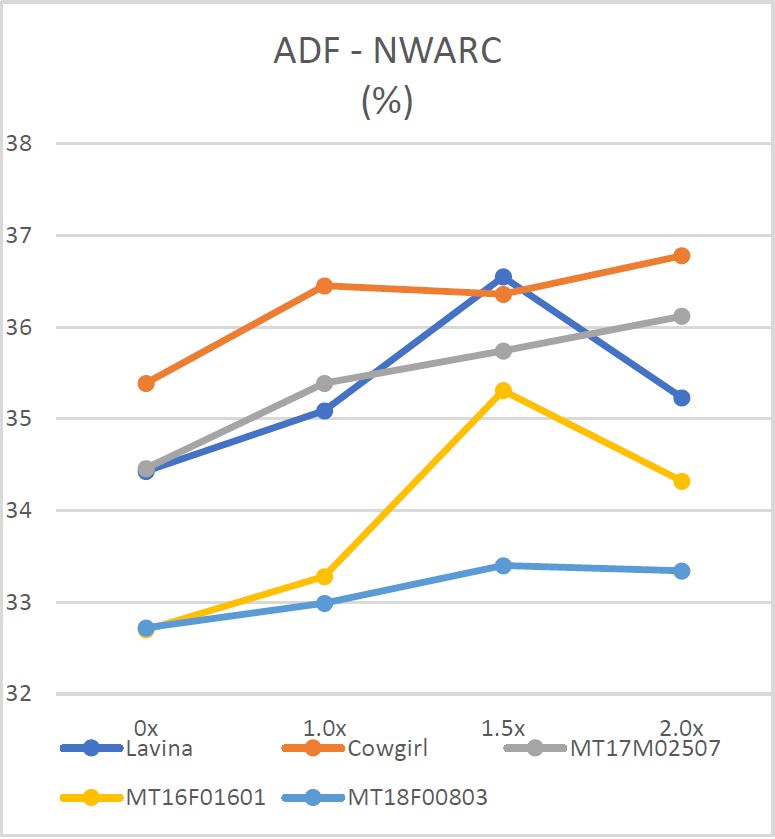
Forage yield increased with N plateauing at about 1.5 N (182 lbs N/ac) (Figure 1). Nitrates increased with N, however, most varieties had acceptable nitrates at and below 1.5 N (Figure 2). NDF and ADF were relatively stable across N treatments (Figure 3). If a grower could feed an awned line, then from the data MT17MO2507 performs well for forage yield and outperforms all other lines for grain yield.
Table 1. Management information |
|||
|---|---|---|---|
| Seeding date: | 4/29/2022 | Field Location: | Y9 |
| Julian date: | 119 | Harvest date: | 8/18/2022 |
| Seeding rate: | 25 plants/ft2 | Julian date: | 230 |
| Previous crop: | Canola | Soil type: | Swims Silty Clay Loam |
| Herbicide: | Axial Bold + Cleansweep - 6/1/22 | Tillage: | Conventional |
| Insecticide: | NA |
Soil residual nutrient (NO3-1, P, K lb/A): |
47-40-342-30s |
| Fungicide: | NA | Nutrient fertilizer applied (lbs/A): | 0, 67, 135, 202 N |
Table 2. Agronomic performance |
||||||||||
|---|---|---|---|---|---|---|---|---|---|---|
| Variety/Line | N treatment | Forage YLD2 | Nitrate2 | ADF1,2 | NDF1,3 | HD1,3 | HT1,2 | Grain YLD1,2 | Grain PRO1,2 | Test WT1,3 |
| tons/A | mg/L | julian | cm | bu/A | % | lbs/bu | ||||
| Lavina | 0x | 2.4 | 0.0 | 34.4 | 61.1 | 185 | 55.5 | 28.5 | 11.3 | 46.9 |
| Cowgirl | 0x | 2.1 | 0.0 | 35.4 | 61.0 | 183 | 61.6 | 24.6 | 11.9 | 46.9 |
| MMT18F00803 | 0x | 2.2 | 0.0 | 32.7 | 57.5 | 185 | 56.7 | 33.1 | 11.1 | 43.4 |
| MT16F01601 | 0x | 2.4 | 0.0 | 32.7 | 57.3 | 183 | 57.8 | 32.7 | 11.3 | 46.6 |
| MT17M02507 | 0x | 2.0 | 0.0 | 34.5 | 60.2 | 183 | 59.7 | 49.2 | 9.3 | 51.0 |
| Lavina | 1x | 3.9 | 12.4 | 35.1 | 60.8 | 186 | 70.9 | 34.8 | 11.8 | 46.8 |
| Cowgirl | 1x | 4.2 | 0.0 | 36.5 | 62.4 | 185 | 83.2 | 30.2 | 12.2 | 46.3 |
| MMT18F00803 | 1x | 4.5 | 55.1 | 33.0 | 57.2 | 186 | 80.7 | 41.7 | 12.0 | 45.0 |
| 'MT16F01601 | 1x | 4.1 | 34.9 | 33.3 | 57.1 | 183 | 82.4 | 48.8 | 12.1 | 47.7 |
| MT17M02507 | 1x | 4.5 | 7.6 | 35.4 | 60.3 | 184 | 81.5 | 90.4 | 9.9 | 52.0 |
| Lavina | 1.5x | 5.2 | 469.7 | 36.6 | 62.4 | 185 | 90.2 | 40.7 | 14.0 | 46.4 |
| Cowgirl | 1.5x | 4.9 | 405.9 | 36.4 | 61.6 | 185 | 96.5 | 34.1 | 14.4 | 45.7 |
| MMT18F00803 | 1.5x | 4.8 | 142.5 | 33.4 | 58.0 | 187 | 85.1 | 53.6 | 13.5 | 44.9 |
| 'MT16F01601 | 1.5x | 5.5 | 130.4 | 35.3 | 61.1 | 184 | 92.5 | 56.9 | 13.4 | 47.1 |
| MT17M02507 | 1.5x | 1.9 | 511.2 | 35.7 | 61.4 | 184 | 89.1 | 106.7 | 10.8 | 52.3 |
| Lavina | 2x | 4.5 | 386.0 | 35.2 | 60.5 | 186 | 89.5 | 42.6 | 13.9 | 45.8 |
| Cowgirl | 2x | 5.3 | 1066.5 | 36.8 | 61.9 | 185 | 99.9 | 46.9 | 14.5 | 45.9 |
| MMT18F00803 | 2x | 5.0 | 317.2 | 33.3 | 58.2 | 187 | 87.4 | 38.7 | 14.1 | 44.5 |
| 'MT16F01601 | 2x | 5.3 | 510.4 | 34.3 | 59.0 | 183 | 90.8 | 57.5 | 14.2 | 46.3 |
| MT17M02507 | 2x | 5.4 | 603.9 | 36.1 | 61.9 | 184 | 91.5 | 101.1 | 11.0 | 52.0 |
| MEAN | 4.2 | 232.7 | 34.8 | 60.0 | 184 | 80.3 | 49.6 | 12.3 | 47.2 | |
| LSD | 0.4 | 219.3 | 0.5 | 0.9 | 0.6 | 3 | 6 | 0.3 | 0.5 | |
| CV | 16.1 | 148.8 | 2.3 | 2.3 | 0.5 | 5.9 | 19.2 | 4.1 | 1.6 | |
| 1Trait variance due to variety P<.001, 2Trait variance due to N Treatment P<.00001, 3P<0.05 | ||||||||||
| Bold = top performer, Bold = statistically equivalent to the top performer | ||||||||||
| YLD = yield, HD = heading date, HT = height, PRO = protein, WT = weight | ||||||||||
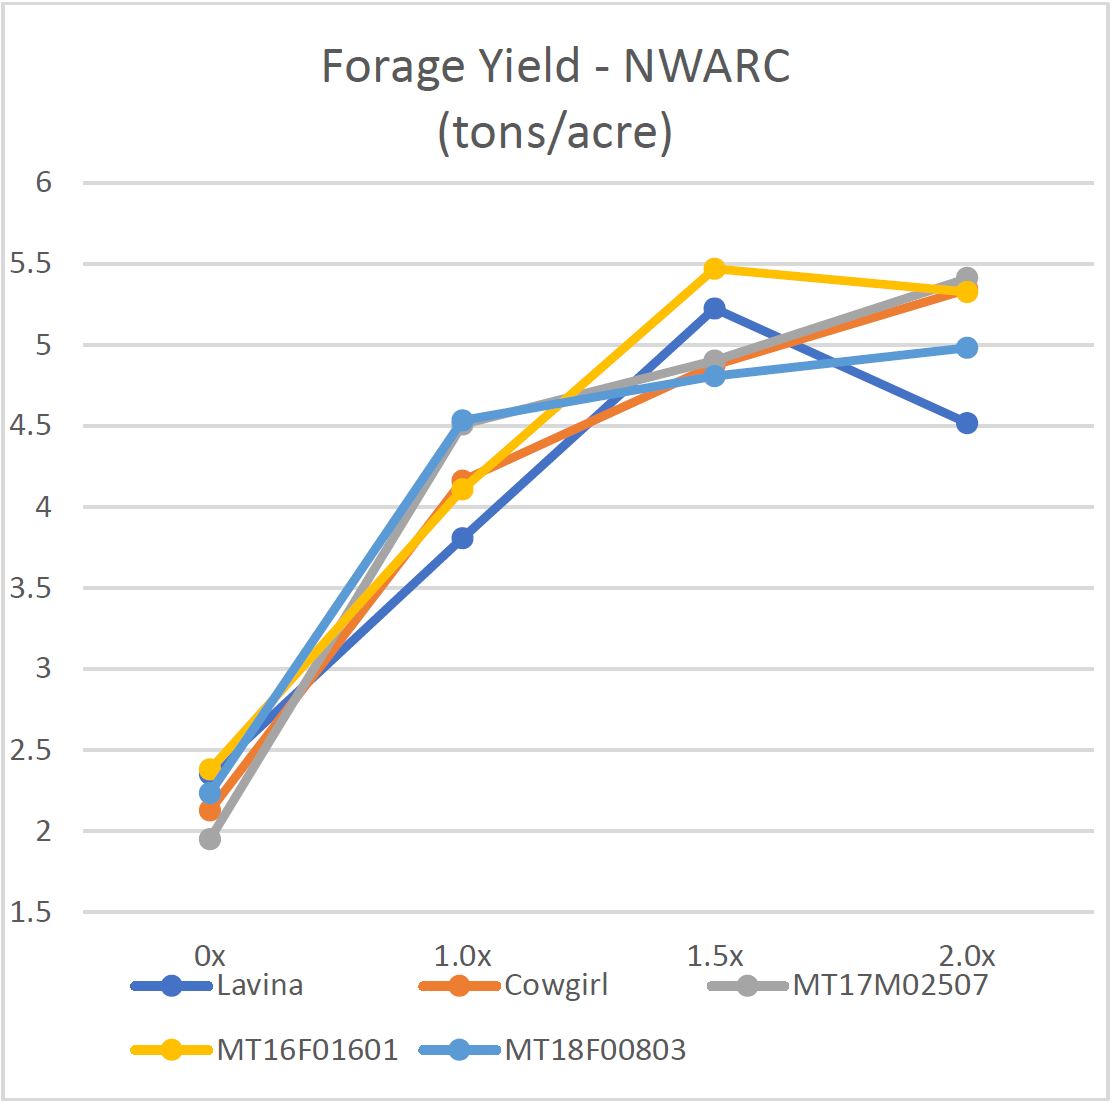
Figure 1. Forage yield with N treatment
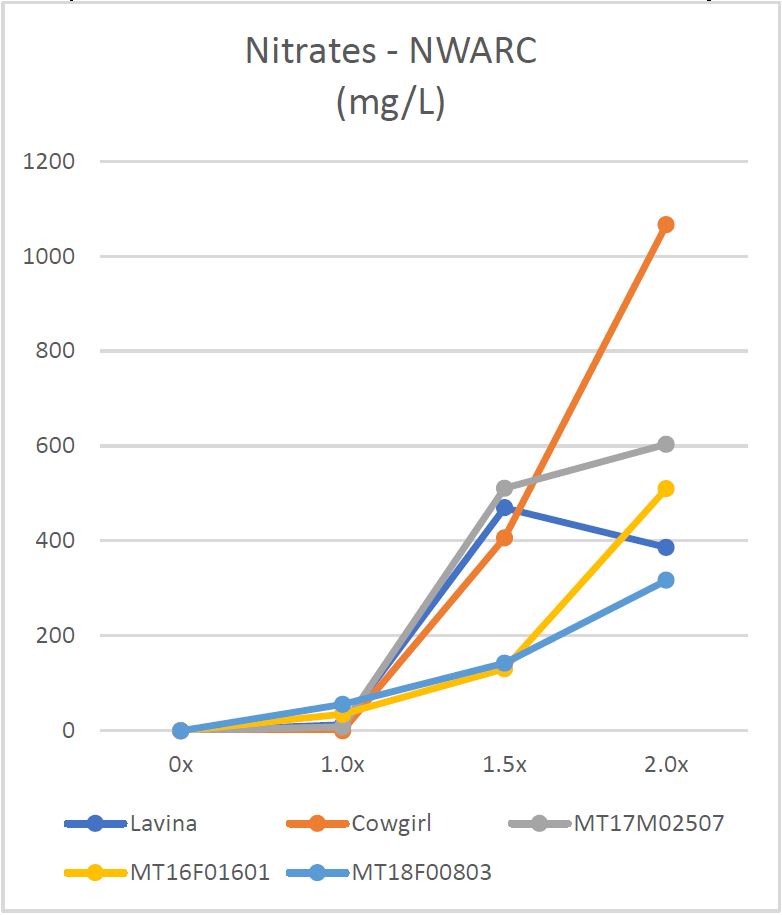
Figure 2. Nitrate with N treatment