
Objective:
To evaluate the agronomic performance of winter wheat with combinations of varieties, populations, and nitrogen fertilizer rates in environments and cropping systems representative of northwestern Montana
Personnel:
Clint Beiermann,Jessica Torrion, Jessica Pavelka, Daniel Porter
Summary:
Winter wheat was planted on October 5th, 2021 with three treatment factors: nitrogen rate, winter wheat variety, and winter wheat population. The levels of each treatment can be reviewed in tables 2 - 4. The was a significant main effect of nitrogen rate on yield with an increase in average yield from 125 bu/acre at the 125 lbs N rate, to 133 bu/acre at 180 lbs N rate. There is not an indication of a significant increase in yield by the 250 lbs/acre rate (Table 2). Winter wheat test weight was higher, between 62.8 and 62.5 lbs/bu at the lower two N rates and was decreased to 62.1 lbs/bu at the 250 lbs/acre N rate (Table 2). Protein increased from 10.7% at the lowest N rate, up to 11.7% at the highest N rate. Thousand kernel weight (TKW) was negatively affected by increasing N rate. Higher TKW indicates larger seed size or higher seed density, which was reduced with increasing nitrogen from 46.2 g at 125 lbs/acre N, to 42.8 g at 250 lbs/acre N (Table 2).
Table 1. Management information |
|||
|---|---|---|---|
| Seeding date: | 10/5/2021 | Field Location: | R5 |
| Julian date: | 278 | Harvest date: | 8/15/2022 |
| Seeding rate: | 16-40 plt/ft2 | Julian date: | 227 |
| Previous crop: | Peas | Soil type: | Creston Silt Loam |
| Herbicide: | CleansweepM+ Axial Bold | Tillage: | Conventional |
| Insecticide: | NA | Soil residual nutrient (NO3-1, P, K lb/A): | 106.5-18-250 |
| Fungicide: | NA | Nutrient fertilizer applied (lbs/A): |
18.5, 73.5, 143.5 N |
Table 2. Nitrogen Rate |
||||
|---|---|---|---|---|
| Nitrogen Rate | Yield | Test wt | Protein | TKW |
| lbs/acre | bu/acre | lbs/bu | % | g |
| 125 | 125 ab | 62.8 a | 10.7 b | 46.2 a |
| 180 | 133 a | 62.5 a | 11.2 ab | 44.5 b |
| 250 | 134 a | 62.1 b | 11.7 a | 42.8 c |
| TKW = thousand kernel weight | ||||
There is an interaction of nitrogen rate and winter wheat variety affecting yield. The varieties Jet and WB1720 respond to increasing N in a linear fashion with subtle yield increase from increasing N rate (Figure 1). The varieties Keldin and WB 1783 show great increase in yield between the 125 lbs/A to 180 lbs/A N, there is minimal gain from 180 lbs/A up to 250 lbs/A (Figure 1). This indicates that the yield of these two varieties is more responsive to N inputs than Jet and WB1720. The variety Jet maintained a higher average yield across N rates than WB 1720, and at higher N rates yielded equivalent to Keldin and WB1783. This indicates that Jet may be a good choice for maintaining yield in situations with limited available N. Of the four varieties WB1720 had the poorest response of yield to increased N inputs.
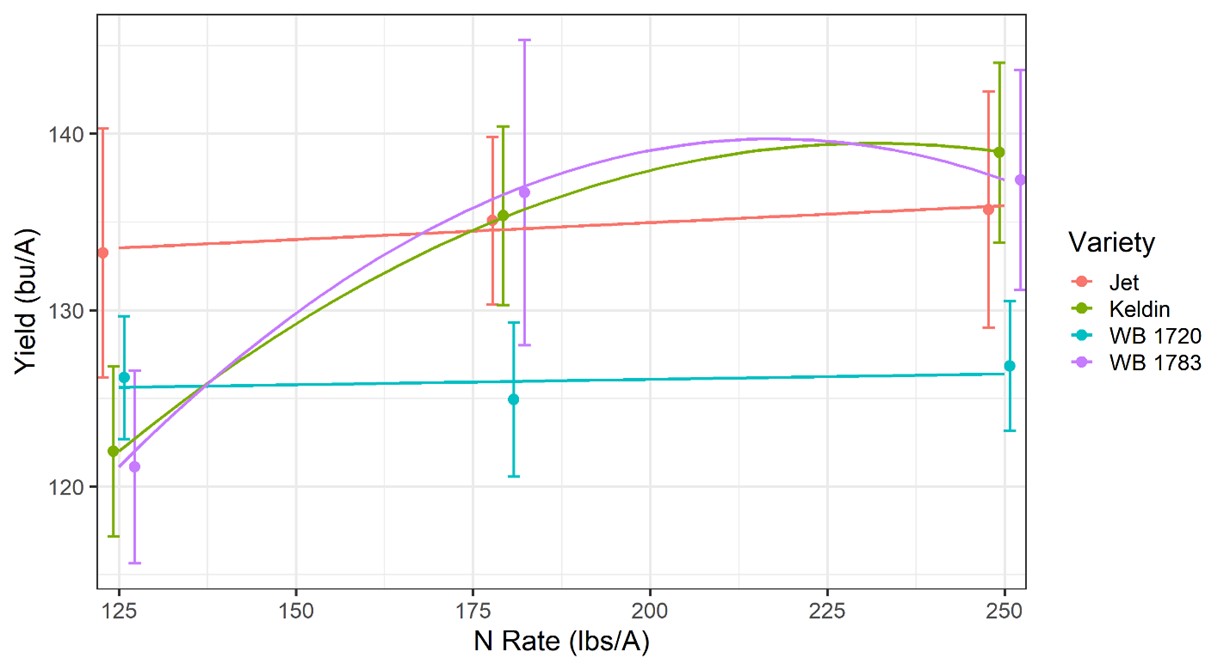
Figure 1. Winter wheat yield
There are several main effects of winter wheat variety on yield and yield components. Test weight is distinctly different for each of the four varieties evaluated. Keldin has the highest average test wt overall, and the highest of the hard red varieties, at 64.1 lbs/bu. WB 1783 is the second highest test wt variety and the highest of the soft white varieties, at 63.2 lbs/bu (Table 3, Figure 2). Keldin has the highest protein of the hard red varieties, and the highest protein overall, at 11.6%. WB 1783 has the lowest protein of all the varieties tested at 10.7% (Table 3). The variety Keldin has a lower number of seeds per head that the other varieties. However, Keldin has the highest thousand kernel weight (TKW) and highest test wt (Table 3). This is likely how Keldin remains a top yielding variety despite having a lower number of individual seeds per head. The two hard red varieties have a higher TKW than the soft white varieties (Table 3).
Table 3. Winter Wheat Market Class & Variety |
||||||
|---|---|---|---|---|---|---|
| Market Class | Variety | Yield | Test wt | Protein | Seeds/head | TKW |
| bu/acre | lbs/bu | % | # | g | ||
| Hard red | Jet | 134 a | 61.5 c | 11.2 b | 46.4 ab | 45.5 b |
| Keldin | 132 ab | 64.1 a | 11.6 a | 43.5 b | 48.6 a | |
| Soft white | WB 1720 | 125 b | 61.1 d | 11.3 b | 47.5 a | 40.6 d |
| WB 1783 | 131 ab | 63.2 b | 10.7 c | 47.9 a | 43.3 c | |
| TKW = thousand kernel weight | ||||||
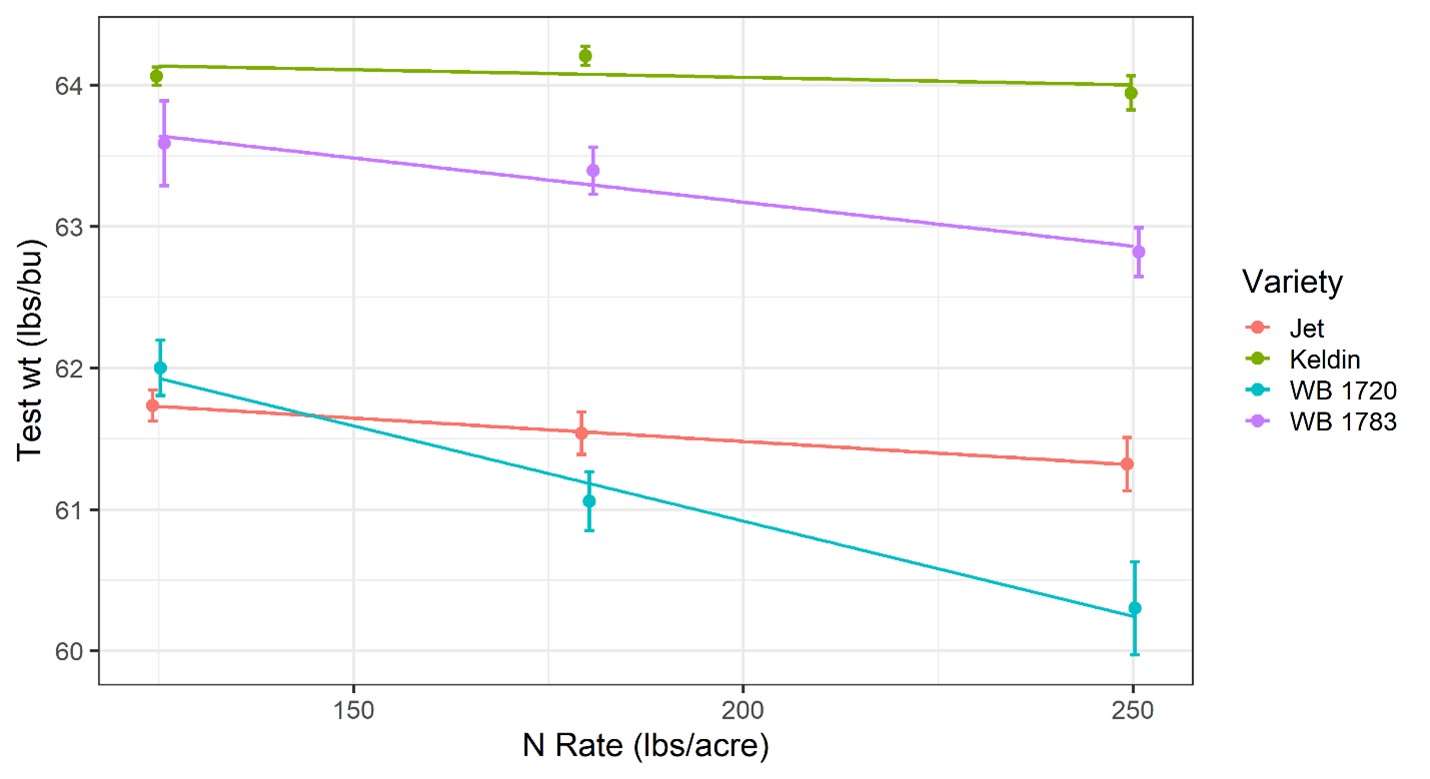
Figure 2. Winter wheat test weight
Of similar response to test weight, thousand kernel weight (TKW) is reduced in each winter wheat variety as nitrogen rate inceases (Figure 3). Of the four varieties tested WB1720 has the lowest average TKW across the range of nitrogen treatments. The TKW of WB1783 is reduced at a more rapid rate by increasing N application, compared to the other varieties (Figure 3).
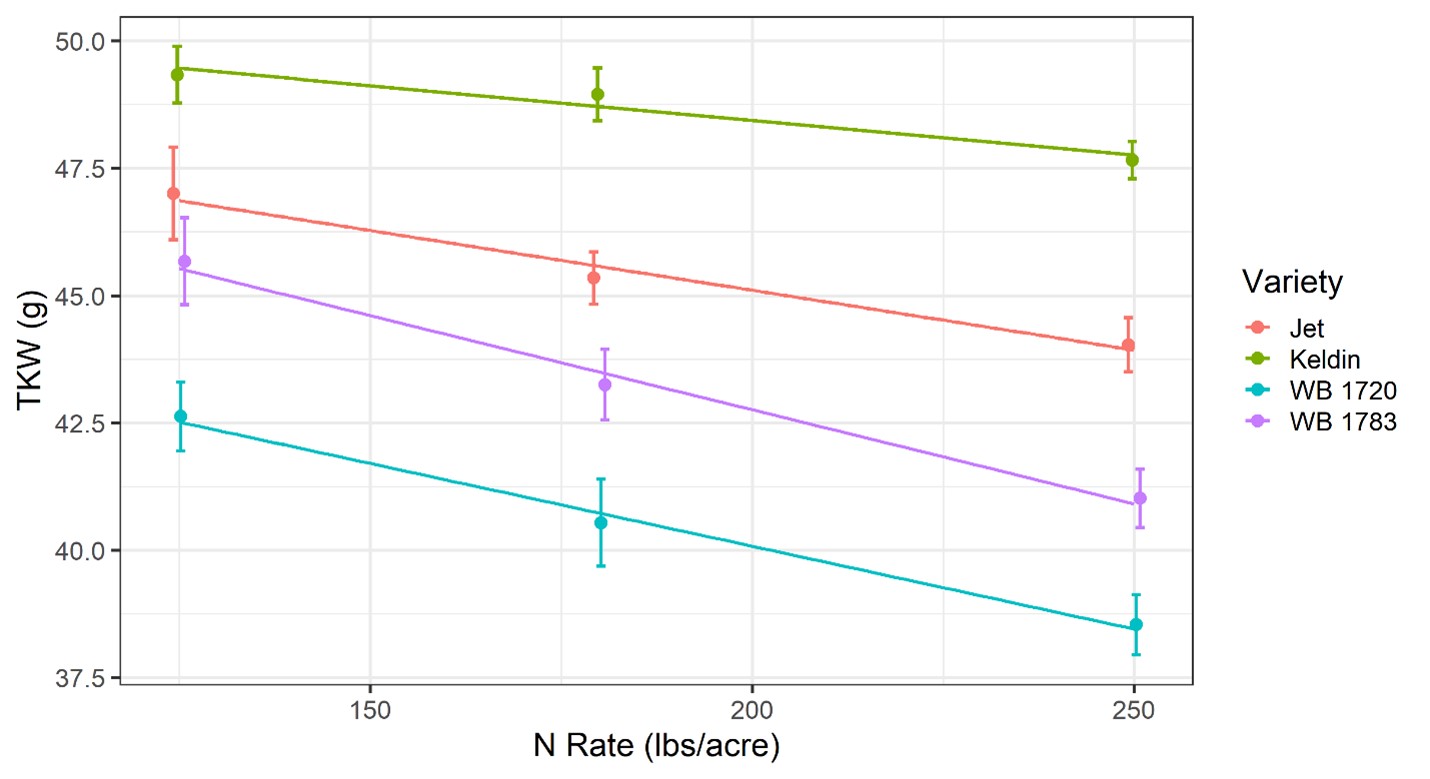
Figure 3. Winter wheat thousand kernel weight
Winter wheat yield increased an average of 8 bu/acre when population was increased from 16 to 24 plants/ft2. Test weight was generally higher when winter wheat was planted at higher densities. The plant population 16 plants/ft2 resulted a test wt of 62.3 lbs/bu; increasing plant population above 16 plants/ft2 resulted in test weights of 62.5 lbs/bu or higher (Table 4).
Average number of heads per plant was 2.7 at the 16 plants/ft2 population. At 24 plants/ft2 heads per plant was reduced to 2.3 and there was further reduction to 1.9 heads per plant when plant population was further increased (Table 4). The number of heads per plant is directly related to the number of tillers that individual wheat plants developed and carried through to maturity. This data indicates that increasing wheat plant population up to 32 plants/ft2, reduced wheat tillers. The number of seeds per wheat head was 50.2 when winter wheat was planted at 16 plants/ft2; seeds per head was reduced to 45.9 when population was increased to 24 plants/ft2 (Table 4). This data shows limited to no yield benefit to increasing seeding rates above 24 plants/ft2.
Table 4. Winter Wheat Plant Population |
|||||
|---|---|---|---|---|---|
| Population | Yield | Test wt | Protein | Heads/plant | Seeds/head |
| plants/ft2 | bu/acre | lbs/bu | % | # | # |
| 16 | 124 b | 62.3 b | 11.3 b | 2.7 a | 50.2 a |
| 24 | 132 a | 62.5 ab | 11.2 a | 2.3 b | 45.9 b |
| 32 | 133 a | 62.6 a | 11.2 ab | 1.9 c | 44.9 b |
| 40 | 133 a | 62.6 a | 11.1 a | 1.7 c | 44.4 b |