Nitrogen Requirement for Sustained Yield and Optimal Quality of Cool-season Perennial Forages
Montana Fertilizer Advisory Committee (MFAC)
Montana Fertilizer Advisory Committee (MFAC)
Project Title:
Nitrogen Requirement for Sustained Yield and Optimal Quality of Cool-season Perennial Forages
Objective:
To test for N requirement, yield, and quality of selected cool-season perennial forage grasses.
Personnel:
J.A. Torrion, Daniel Porter, Hayes Goosey, Peggy Lamb
Summary:
Cool-season perennial grasses were planted on April 21st, 2022, see Table 1 for details. This study was under split-plot design where four N levels are the main plots and four forage species are the subplots. The species were meadow brome, smooth brome, tall fescue, and a dryland mix (comprised of meadow brome, smooth brome, tall fescue, and intermediate wheatgrass). The second harvest this year was done post-first killing frost in October. The total forage yield was influenced by both the N treatments and the forage species. The highest forage yield was observed at N treatment 4 (50 lbs N at tiller + 50 lbs N after 1st cut). The doubling of the fertilizer application in treatment 4, relative to treatment 2, only garnered 20% increase in forage yield. The 50 lbs applications, either applied at planting or split applied at the tiller and after the first cut, had the same yield (Table 2).
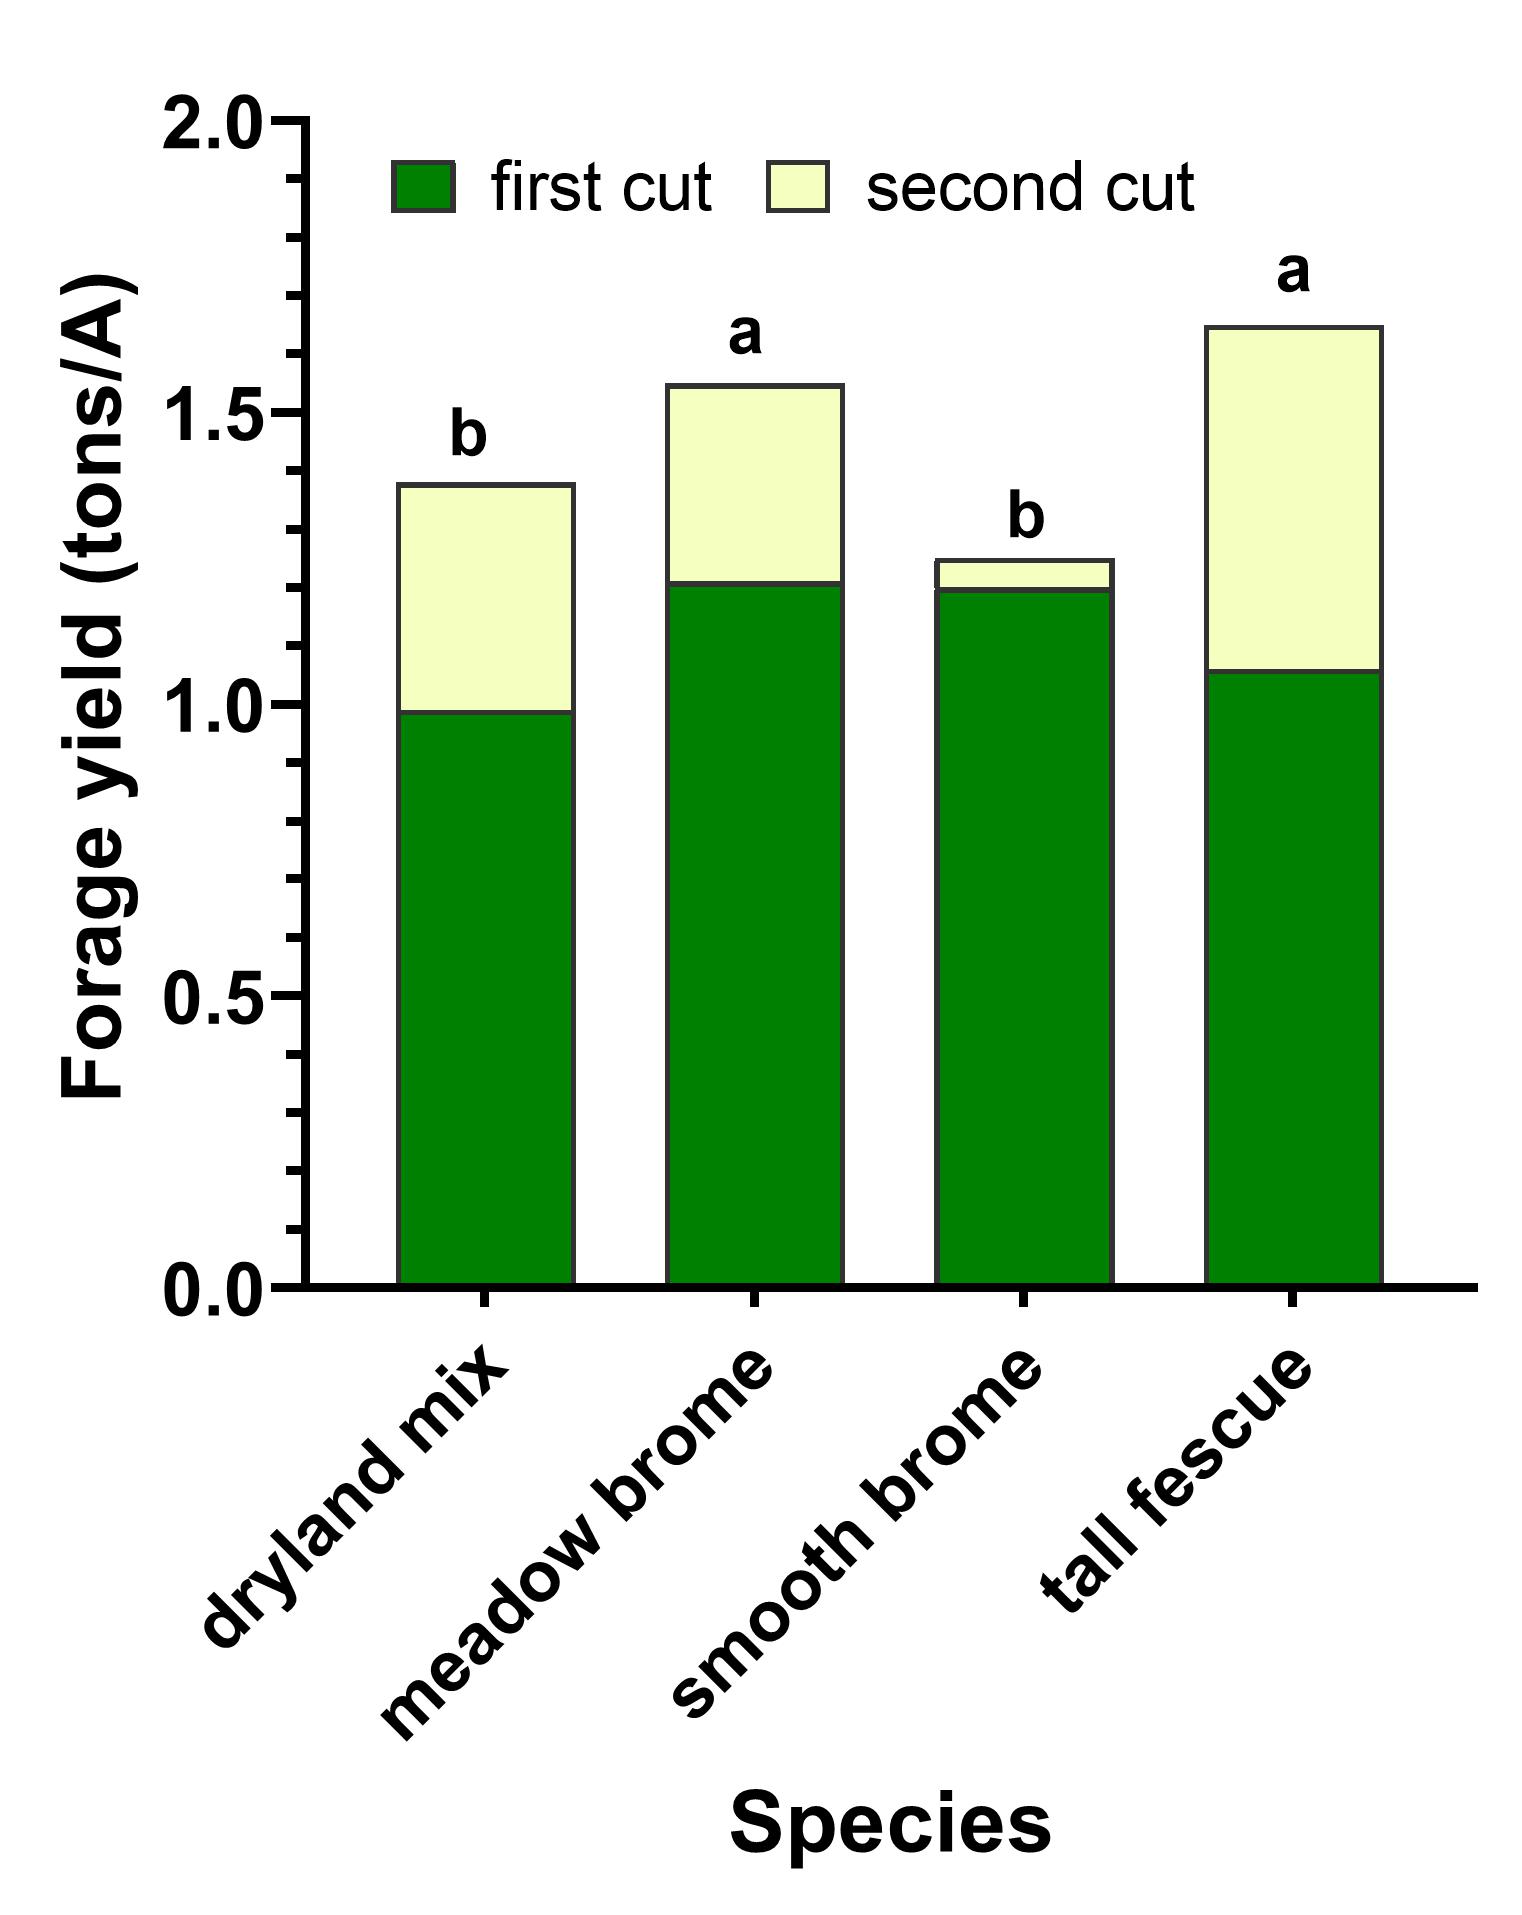
As for the yield by species, both the tall fescue and meadow brome had the highest total yield (Fig. 1). The dryland mix and the smooth brome had the same yields. Notably, the smooth brome only had minimal biomass regrowth after the first cut. The dryland mix also had the lowest forage biomass during the first cut. We insinuate that the dryland mix had the least weed competitive ability. Early in the season, there were several broadleaf weeds observed while waiting for the optimal stage timing of the grass species for herbicide application.
Table 1. Management Table
| Seeding date: | April 21st, 2022 | Field Location: | R3 |
| Julian date: | 111 | Harvest dates: | *See below |
| Seeding rate: | variety dependent | Julian dates: | *See below |
| Previous crop: | Canola | Soil type: | fine sandy loam |
| Herbicide: | Detonate, Cleaver (6/7/2022) | Tillage: | Conventional |
| Insecticide: | Soil residual nutrient: (NO3-, P, K lb/A): | 40-14-260 | |
| Fungicide: | Nutrient fertilizer applied: (N, P2O5, K20 lb/A): | Varied - 20.2 - 14.9 |
Harvest 1 dates: 8/17/2022, 8/18/2022, & 8/30/2022 (Julian 229, 230, & 242)
Harvest 2 post-frost dates: 10/24/2022 & 10/25/2022 (297, & 298)
Table 2. Forage yield by N treatment, Creston, MT. This site had a 40 lbs/A residual NO3-1 and received 2.75 inches of irrigation. The same letter assignment denotes nonsignificant differences at α =0.05 across N treatment.
| N treatment ID | N Treatment | Yield (tons/Ac) |
|---|---|---|
| 1 | Control | 0.88c |
| 2 | 50 lbs N at planting | 1.55b |
| 3 | 25 lbs N at tiller + 25 lbs N after 1st cut | 1.53b |
| 4 | 50 lbs N at tiller + 50 lbs N after 1st cut | 1.87a |

Figure 1.
Forage yield by species at 30% dry matter. The same letter assignment denotes non-significance at α = 0.05. The second cut was done just after the first killing frost. The dryland mix comprises of meadow brome, smooth brome, tall fescue, and intermediate wheatgrass.
Table 3. Cut 1 Quality Creston, MT
| Species | CP % | ADF | NDF | RFV | TDN | NFC % | WSC % |
|---|---|---|---|---|---|---|---|
| dryland mix | 14.8 | 31.7 | 52 | 115.2 | 66.4 | 23.3 | 10.5 |
| meadow brome | 13.6 | 35.1 | 53.6 | 107.1 | 62.6 | 22.8 | 10 |
| smooth brome | 13.4 | 32.2 | 50.7 | 117.5 | 65.8 | 26.8 | 10.6 |
| tall fescue | 14 | 28.3 | 48.7 | 127.7 | 70.3 | 26.4 | 12 |
| Mean | 14 | 31.8 | 51.3 | 116.9 | 66.3 | 24.8 | 10.8 |
| CV | 11 | 9.5 | 5.6 | 8.5 | 5.2 | 14 | 9.2 |
| LSD | 1.4 | 2.8 | 2.8 | 8 | 3.2 | 3.1 | 0.6 |
| PR > F | 0.042 | <0.0001 | <0.0001 | <0.0001 | <0.0001 | 0.0002 | <0.0001 |
CP: crude protein, ADF: acid detergent fiber, NDF: neutral detergent fiber, RFV: relative feed value, TDN: total digestible nutrient, NFC: non-fibrous carbohydrate, WSC: water-soluble carbohydrate
Forage quality was species-dependent, and N application did not influence them. Tall fescue had the highest relative feed value, including total digestible nutrients, non-fibrous carbohydrates, and water-soluble carbohydrates (Table 3). Tall fescue had the highest relative feed value in the second cutting (data not shown).
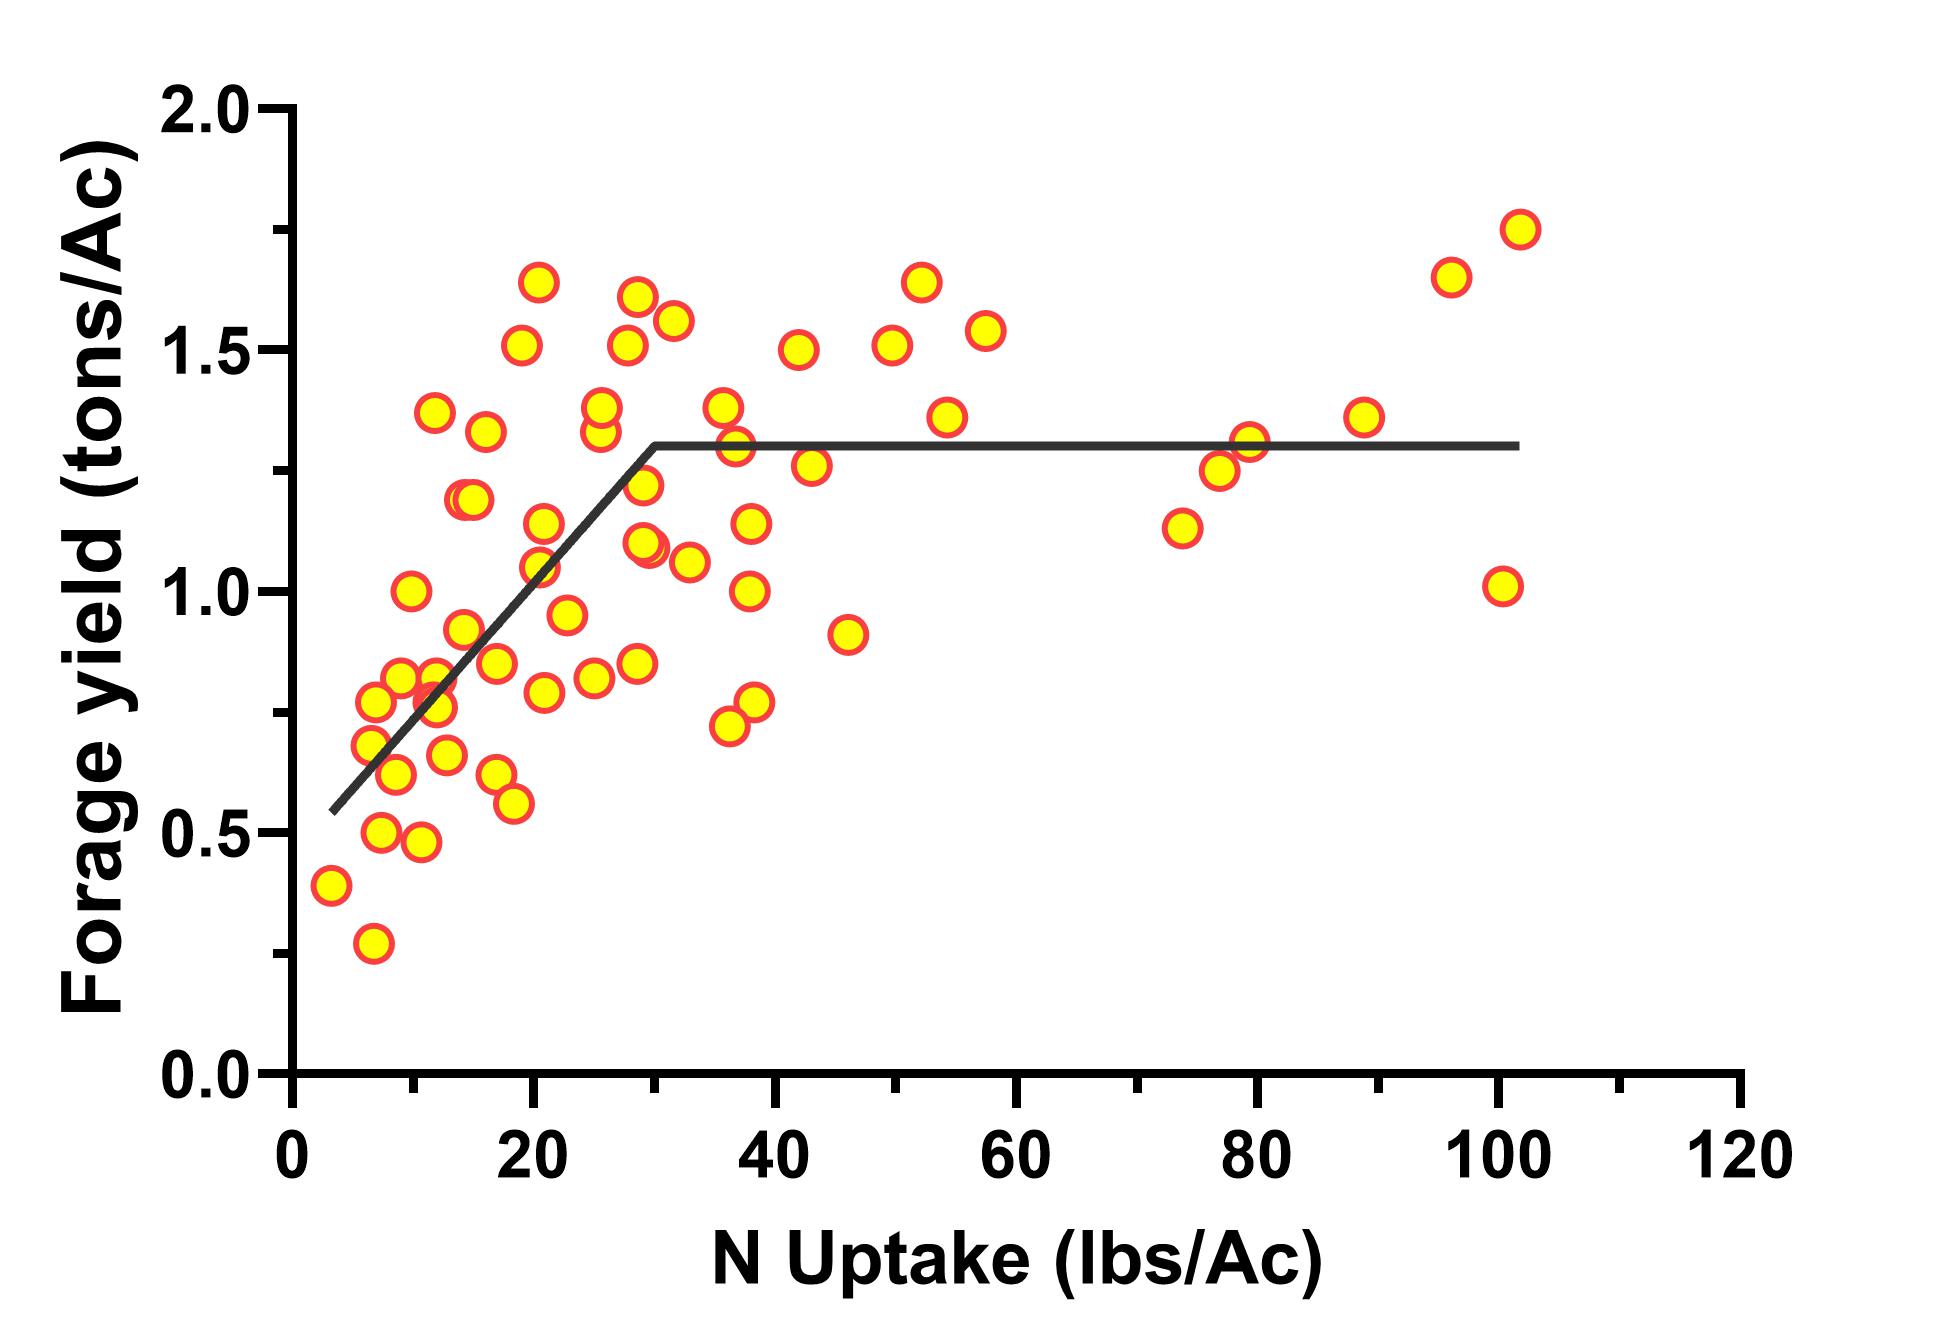
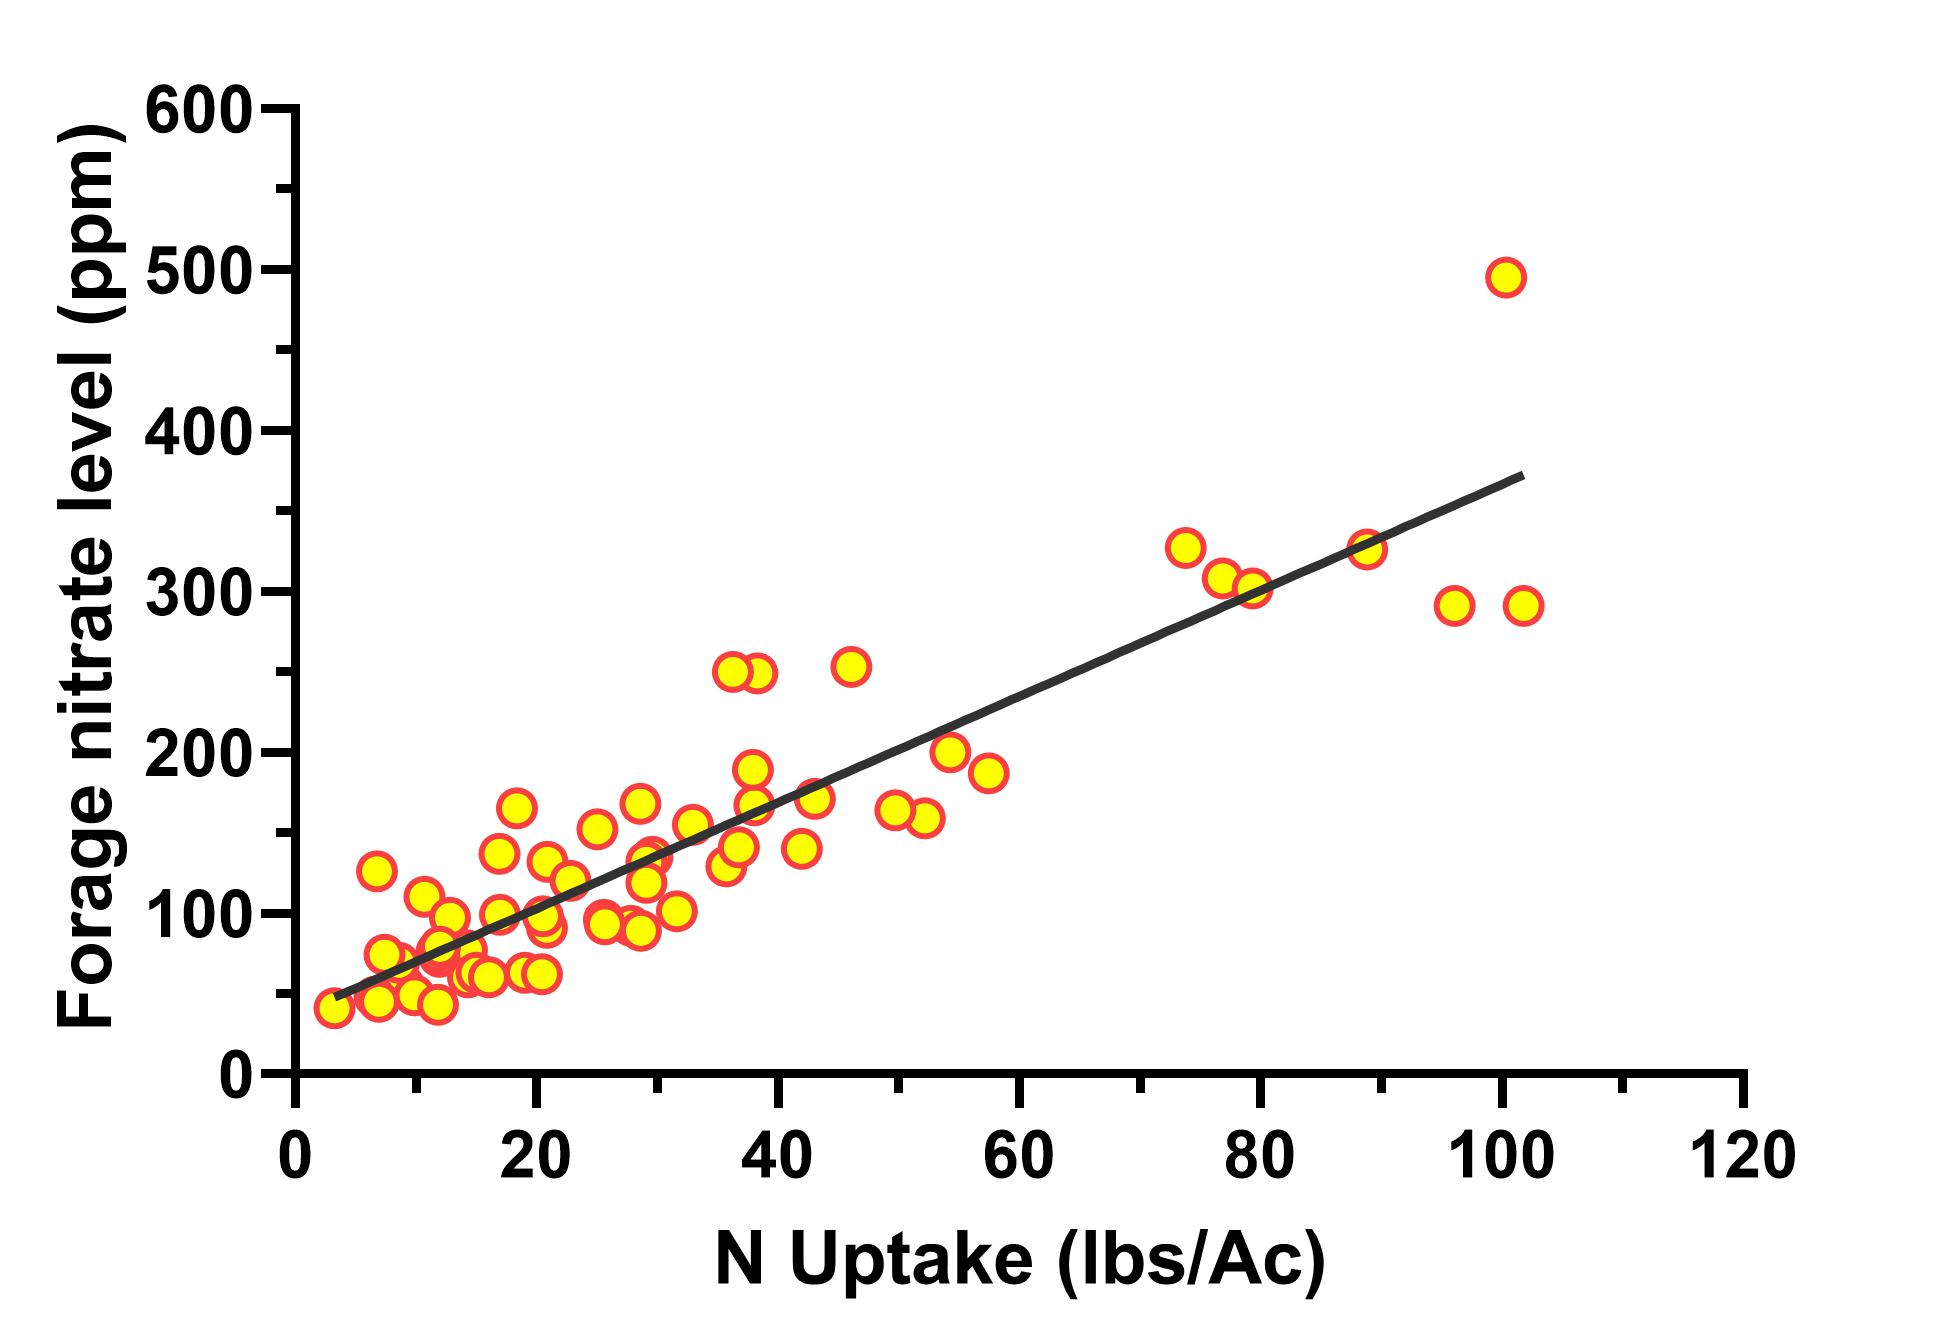
We also evaluated the relationship between N uptake and forage yield of the first cutting (Fig. 2). As with other forages, the plant can take excessive available N with no observed yield advantage but only increases tissue nitrate level (Fig. 3).

Figure 2. Non-linear upper plateau regression between N uptake and forage yield, cut 1, Creston, MT.

Figure 3. The linear relationship between nitrogen update and forage nitrate level, cut 1, Creston, MT.
