Quantifying the Impact of Irrigation and Precipitation Timings on Winter Wheat Yield and Quality

Project Title:
Quantifying the Impact of Irrigation and Precipitation Timings on Winter Wheat Yield and Quality
Objective:
To determine the agronomic impacts of the various irrigation strategies and simulated rain winter wheat cultivars.
Personnel:
J.A. Torrion, Daniel Porter, Eeusha Nafi
Summary:
This study was laid out in a split-plot design, where the water regime treatment was the main plot, and the eight-winter wheat (four hard reds and four soft whites) was the subplot. This was also conducted over two environments: 1) rainfall received for the whole study was from the naturally occurring rainfall events, and 2) received additional simulated rainfall via overhead sprinklers over the grain-filling duration to quantify the effect of rainfall timings on grain quality and yield. See Table 1 for the management information.
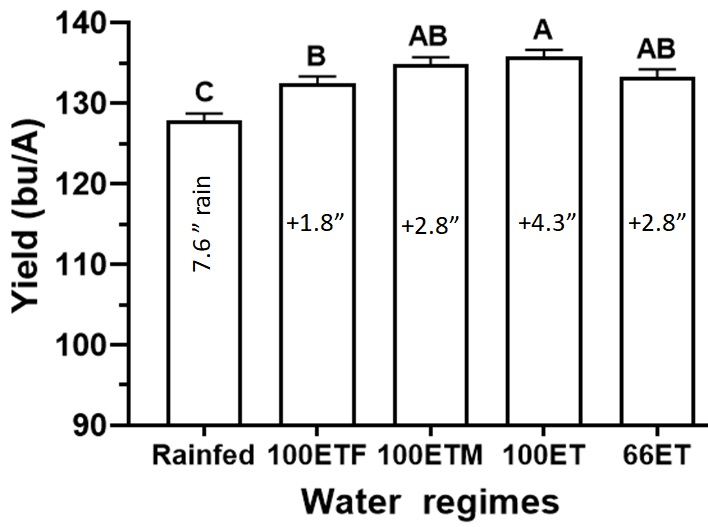
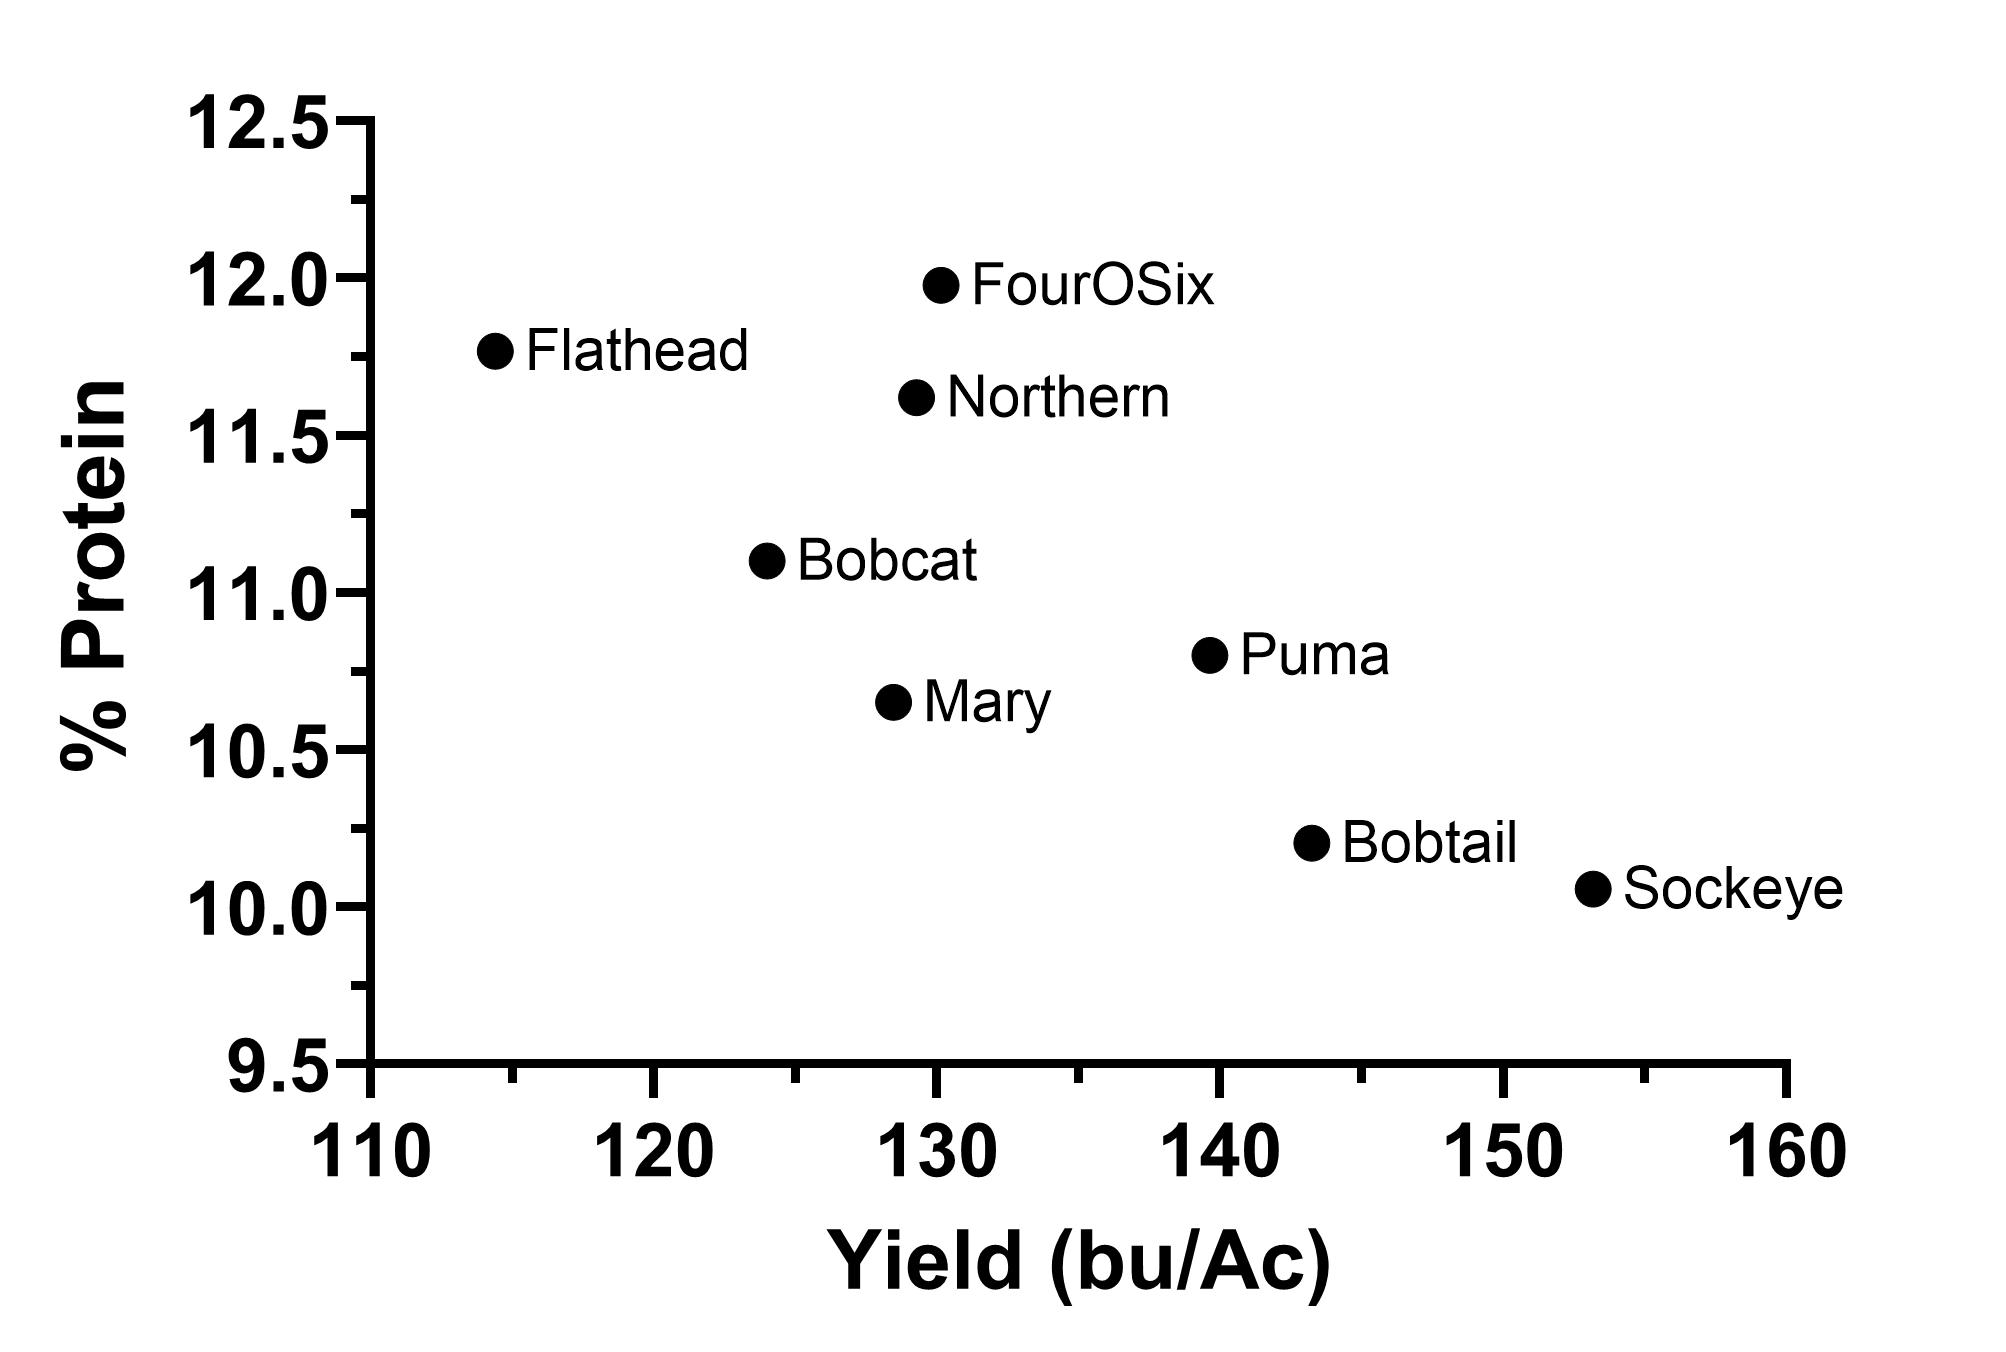
There was no interaction between the water regime treatments and the two environments. Overall, under the 2022 condition, applying the final irrigation at or just after flowering was enough to achieve the optimal yield (Fig. 1). Additional irrigation after that, either in full amount or via deficit (66ET), did not show any yield advantage. This year, the total rain received was 7.6”, and the established winter wheat rooting system in spring can utilize both the stored soil moisture and the early rains in spring. In an environment where a total additional 1.0” rainfall was simulated using the overhead sprinkler (four events at 0.25” each across the grain filling stages), gained +14 bushels more across water regime treatments. There was no relation between water regimes and grain protein. In this study, grain protein was strongly related to the variety used and the market class. In Figure 2, the hard red winter wheat (Flathead, FourOSix, Northern, and Bobcat) had higher protein (but lower yield) compared with the soft whites (Mary, Puma, Bobtail, and Sockeye). The soft whites have higher yields but lower protein than the hard reds (as shown in the negative relationship between protein and yield, Fig. 2).
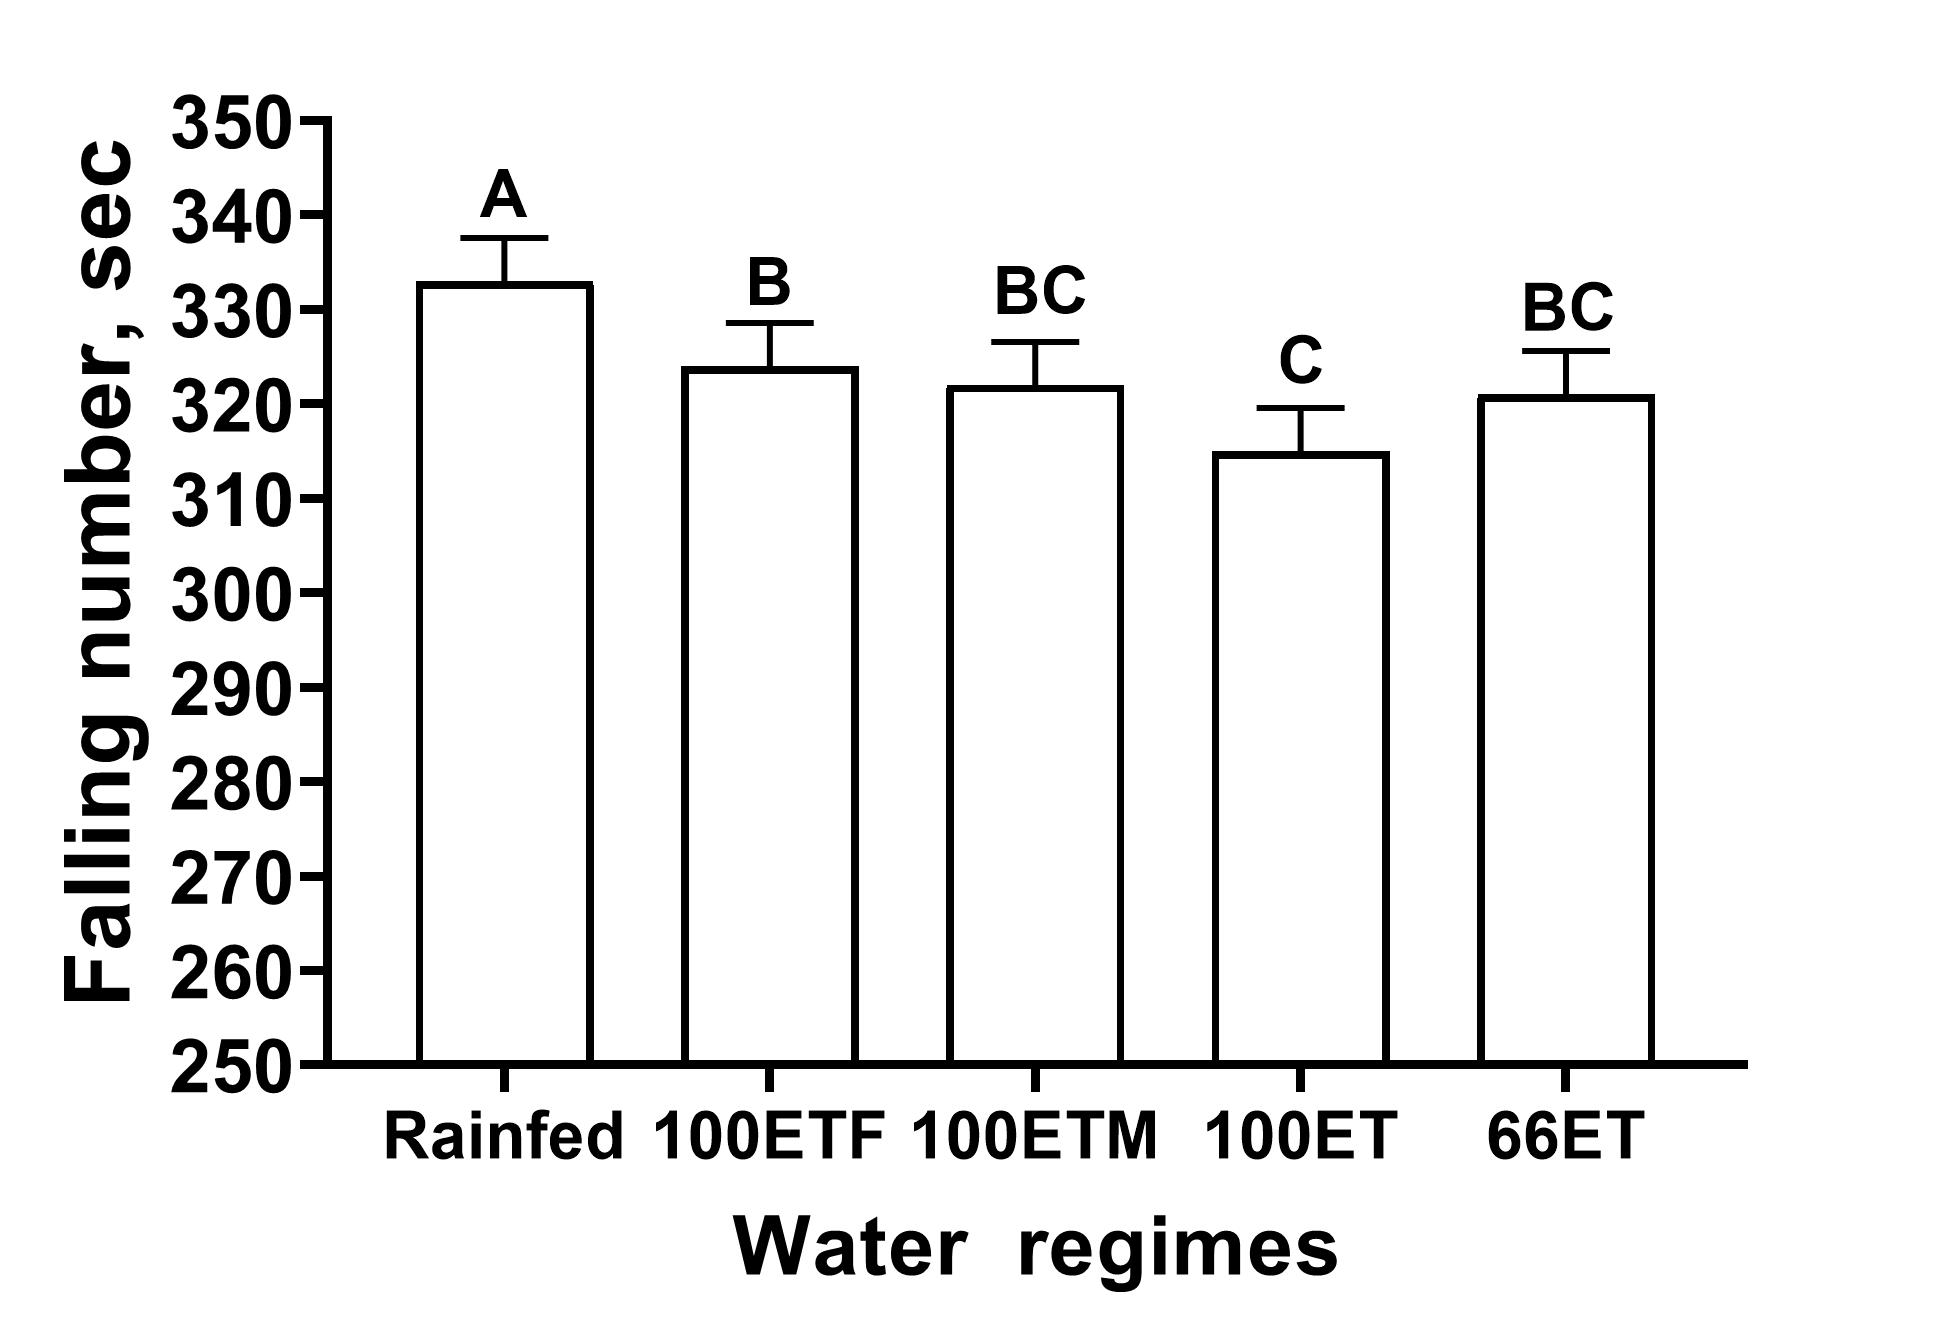
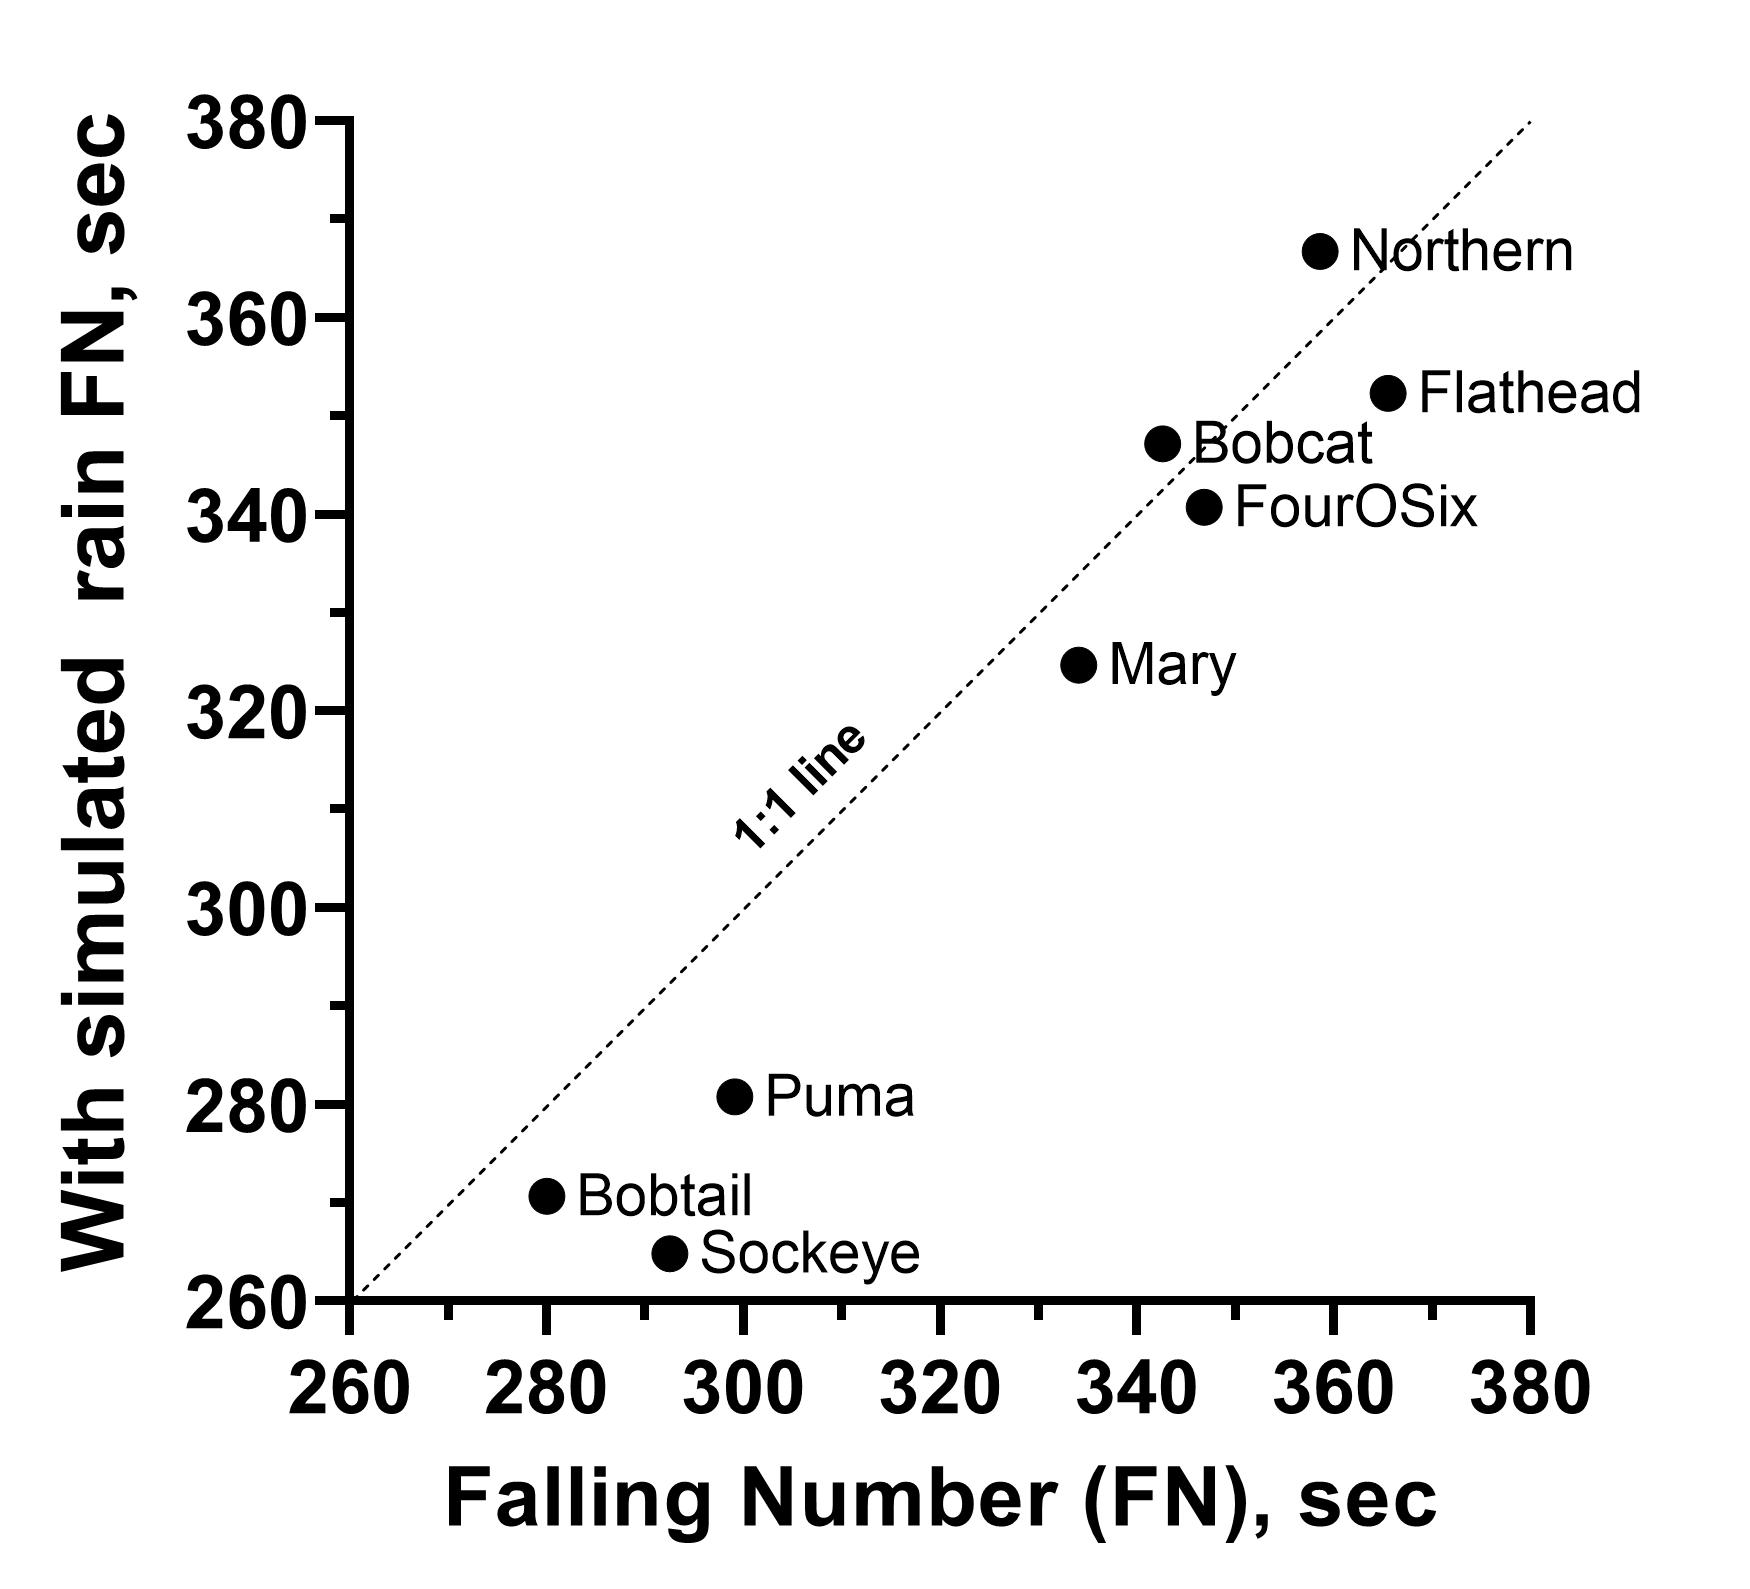
As for the falling number (FN) test, applying irrigation later in the season (regardless of the amount tend to lower FN further regardless of market class (Fig. 3). The soft white is even more susceptible to lowered FN. In other areas of the United States, soft whites tend to have lower FN and tend to be susceptible to preharvest sprout. Applying irrigation later in the season does not improve yield but aggravates lowered FN. Terminating irrigation earlier then, is advantageous. This outcome is similar to our 5-year of research in spring wheat. Further, the additional rainfall events via the simulated rainfall using the overhead sprinkler lowered FN values even more, regardless of market class (Fig. 4). Most of the varieties are below the 1:1, except Bobcat and Northern, indicating that most of the varieties regardless of market class tended to reduce FN values with the simulated rainfall events (y-axis of Fig. 4) later in the season.
Table 1. Management Information
| Seeding date: | 9/23/2021 | Field Location: | R5 |
| Julian date: | 266 | Harvest date: | 8/10/2022 |
| Seeding rate: | Standard | Julian date: | 222 |
| Previous crop: | Peas | Soil type: | fine sandy loam |
| Herbicide: | Clean SweepM & Axial Bold (5/10/22) | Tillage: | Conventional |
| Insecticide: | Soil residual nutrient (NO3-, P, K lb/A): | 106-18-250 | |
| Fungicide: | Headline (6/9/2022) | Nutrient fertilizer applied (N, P2O5, K2O lb/A): | 85-0-0 (5/3/2022) |

Figure 1.
Yield responses with water regimes. The ‘+’ symbols are the irrigation amounts received per treatment. The 100 percent evapotranspiration (100ET) is with no stress. The 100ETF is a no-stress treatment until after flowering (the final irrigation was applied within the flowering stage). The 100ETM is also a no-stress treatment until after milk (the final irrigation was applied at the milk stage). The 66ET is the deficit treatment (applying only 2/3 of what was applied in the 100ET treatment at each irrigation event). The same letter assignment denotes non-significance at α=0.05.

Figure 2.
Grain protein and yield relationship of the varieties. The hard reds are Flathead, FourOSix, Northern, and Bobcat. The soft whites are Mary, Puma, Bobtail, and Sockeye.

Figure 3.
Falling number response with water regimes. The 100 percent evapotranspiration (100ET) is with no stress. The 100ETF is a no-stress treatment until after flowering (the final irrigation was applied within the flowering stage). The 100ETM is also a no-stress treatment until after milk (the final irrigation was applied at the milk stage). The 66ET is the deficit treatment (applying only 2/3 of what was applied in the 100ET treatment at each irrigation event). The same letter assignment denotes non-significance at α=0.05.

Figure 4.
Falling number relationship between the irrigated environment with simulated rainfall events (y-axis) vs. the irrigation environment without the simulated rainfall events (x-axis). The hard reds are Flathead, FourOSix, Northern, and Bobcat. The soft whites are Mary, Puma, Bobtail, and Sockeye.
