Test Five Elite Spring Wheat Varieties to Evaluate Impact of Reduced Seeding and Nitrogen Rates on End-Use Quality and Agronomic Performance in Drought Conditions

Project Title:
Test Five Elite Spring Wheat Varieties to Evaluate Impact of Reduced Seeding and Nitrogen Rates on End-Use Quality and Agronomic Performance in Drought Conditions
Objective:
To assess the effects of reducing inputs on end-use quality and yield performance
Personnel:
J.A. Torrion, Daniel Porter, J. Cook, J. Vetch, C. Beiermann
Summary:
This study was conducted at Creston and Conrad locations. The study was laid out in a split-split-plot design where the main plot was nitrogen (N) treatments. The subplot was the five elite spring wheat varieties (Vida, Dagmar, Egan, MT Sidney, and Sy Ingmar), and the sub-subplot was the seeding rates randomly arranged within each variety. This study was replicated three times. For the Creston location, the N treatments were: control (no added N), 150 lbs total N (residual + added Urea), and 200 lbs total N (residual +added Urea). The seeding rates were: 24, 16, and 12 live seeds/ft2. Management information for the Creston location is detailed in Table 1.
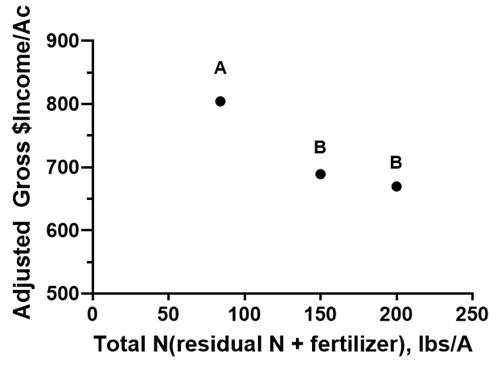
There was no yield response with increasing N levels in either Creston or Conrad locations. As for the seeding rates, the yield in Creston was reduced with decreasing seeding rate (Fig. 1). For Creston, 24 live seeds/ft2 is optimal. In previous studies, during extreme drought, we typically observed no yield response to seeding rates. Under a drier environment (Conrad), seeding at 18 live seeds/ft2 is optimal this year – that is, between 50-70 lbs/Ac seeds depending on seed size (Fig. 2). For either of the locations, Vida followed by Dagmar consistently outperformed the other varieties regardless of seeding rates (Figs. 3 and 4). The relationship between yield and protein of the five elite varieties for the Creston location is shown in Figure 5. The highest yielding (Vida) also had the lowest protein, whereas, the lower yielding (Egan) had the highest protein. For Creston and Conrad sites, the grain protein content responded with increasing N (see Fig. 6 for Creston, Conrad data not shown). For the Creston location, based on the estimated adjusted gross income in Fig. 7, 150 lbs/A total N input (residual + applied) is optimal. This is consistent with our historical studies of this location.
Table 1. Management Table
| Seeding date: | 4/20/2022 | Field Location: | R6 |
| Julian date: | 110 | Harvest date: | 8/23/2022 |
| Seeding rate: | Various | Julian date: | 235 |
| Previous crop: | Alfalfa | Soil type: | fine sandy loam |
| Herbicide: | Axial Bold, CleansweepM (6/1/2022) | Tillage: | conventional |
| Insecticide: | Soil residual nutrient (NO3-, P, K lb/A): | 79-4-84 | |
| Fungicide: | Headline (7/1/2022) | Nutrient fertilizer applied (N, P2O5, K2O lb/A): | varied-45-100 |
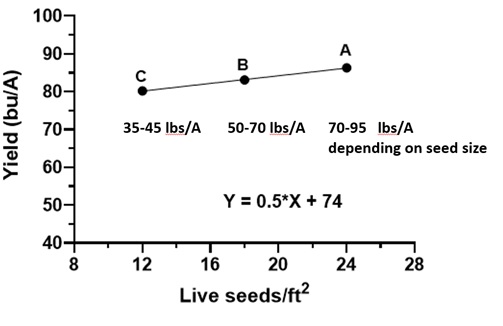 Figure 1.
Yield response to seeding rates, Creston, MT. The same letter of assignment denotes non-significance at α=0.05.
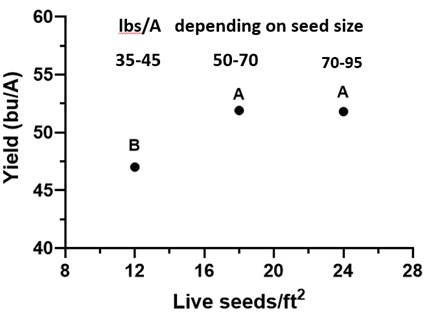 Figure 2.
Yield response to seeding rates, Conrad, MT. The same letter of assignment denotes non-significance at α=0.05.
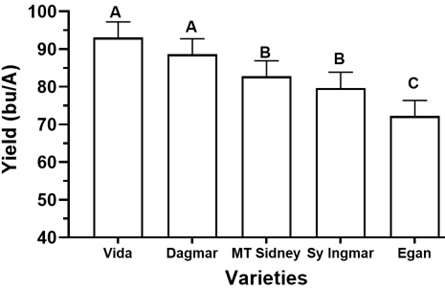
Figure 3. Yield response with the elite varieties, Creston, MT. The same letter of assignment denotes non-significance at α=0.05.
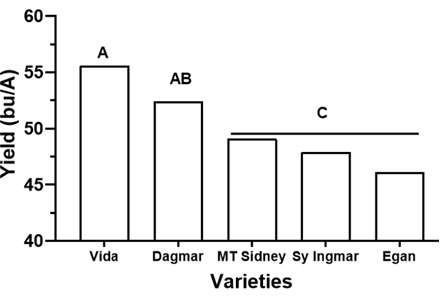
Figure 4. Yield response with the elite varieties, Conrad, MT. The same letter of assignment denotes non-significance at α=0.05.
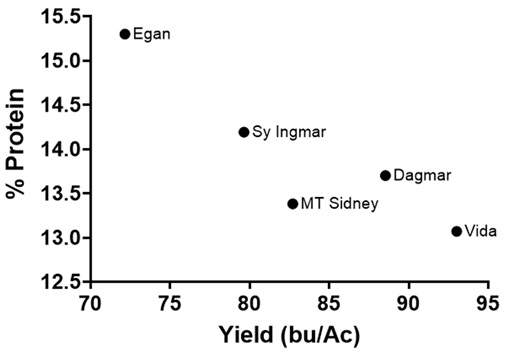
Figure 5. Yield vs. protein relationship amongst the elite varieties, Creston, MT.
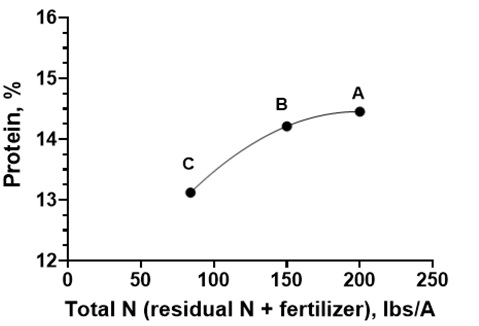
Figure 6. Protein response with nitrogen (N) treatment, Creston, MT
