
2025 Cutting Schedules and Alfalfa Fall Dormancy Impacts on Yield and Quality under Irrigated Conditions
Saurabha Koirala, Marilyn Dalen, Emily McGarvey, and Jessica Torrion
Objective
The purpose of this study is to evaluate the yield and quality of alfalfa cultivars with different fall dormancy ratings (FD 3–7) and cutting schedules under irrigated conditions.
Summary
The experiment was laid out using a split-plot design with four replications. The cutting schedule was the whole plot factor and included three treatments: bud (harvest at 50% bud stage), 10% flower (harvest at 10% flowering stage), and staggered (the first cut at the bud stage and the second cut at over 50% flowering stage). The subplot factor was the FD ratings of the varieties (3-7). ‑holding capacity. Total irrigation applied was 8.2 inches in 2024 and 7.2 inches in 2025
In 2024, the bud cutting schedule was cut three times, whereas the other schedules were cut twice. In 2025, the bud and staggered cutting schedules were cut four times, and the 10% flowering schedule was cut three times. Center-pivot irrigation was used based on an estimated daily crop water usage from reference evapotranspiration, rainfall, and soil water holding capacity. Total irrigation applied was 8.2 inches in 2024 and 7.2 inches in 2025 respectively. Dry matter (DM) yield was adjusted to 70% moisture basis to ensure fair comparison among treatments. Management details are provided in Table 1.
Cutting schedules had a modest effect on DM yield in 2024, as the year of establishment. The bud and 10% flower schedule produced similar DM yields, whereas the staggered cutting schedule produced the lowest DM yield (Figure 1). In 2025, the DM yields were more than double that of 2024. In 2025, the staggered schedule produced greater DM yield, followed by the 10% flower schedule, with bud cutting schedule yielding the least (Figure 1). DM yield responses varied significantly among fall dormancy (FD) varieties and year (significant interactions in Table 2). In 2024, FD3, FD4, and HVX4 were the lowest-yielding group, whereas FD5, FD6, and FD7 produced slightly higher yields. The FD4 variety had the greatest DM yield, whereas FD3, HVX4, FD5, FD6, and FD7 yielded similarly in 2025 (Figure 2). Overall, the staggered cutting schedule and the FD4 variety produced the strongest yield responses under irrigated conditions during the second year of establishment.
Table 1: Management Information |
|||
|---|---|---|---|
|
Seeding date: |
5/23/2024 (144 Julian) |
Field Location: |
R4 |
|
Seeding rate: |
30 seeds per ft2 |
Harvest dates: |
Varied by TRT |
|
Previous crop: |
Winter Wheat |
Soil type: |
Flathead Fine Sandy Loam |
|
Herbicide: |
Buccaneer 24oz/A, Preplant: Triflurex hfp 1pt/A |
Tillage: |
Conventional |
|
Soil residual nutrients (NO3-, P, K lb/A): |
65-12-123 (Fall, 2023) |
||
|
Insecticide: |
Crusader 1EC 3.84oz/A |
||
|
Nutrient fertilizer applied (N, P2O5, K2O lb/A): |
10-60-150 (Spring, 2024) |
||
|
Fungicide: |
N/A |
||
Table 2: Analysis of Variance for the Main Effects of Cutting Schedule, Varieties, and Year on Alfalfa Dry Matter (DM) Yield. |
||
|---|---|---|
|
Effect |
Degree of freedom |
P-value |
|
Cutting schedule |
2 |
0.013 |
|
Varieties |
5 |
<.0001 |
|
Cutting schedule * Varieties |
10 |
0.1673 |
|
Year |
1 |
<.0001 |
|
Year*Cutting schedule |
2 |
<.0001 |
|
Year*Varieties |
5 |
<.0001 |
|
Year*Cutting schedule *Varieties |
10 |
0.060 |

Figure 1. Effect of cutting schedules on dry matter yield, averaged across varieties and cutting events in 2024-2025. Same letter assignment denotes non-significance across cutting schedules and years at α=0.05.
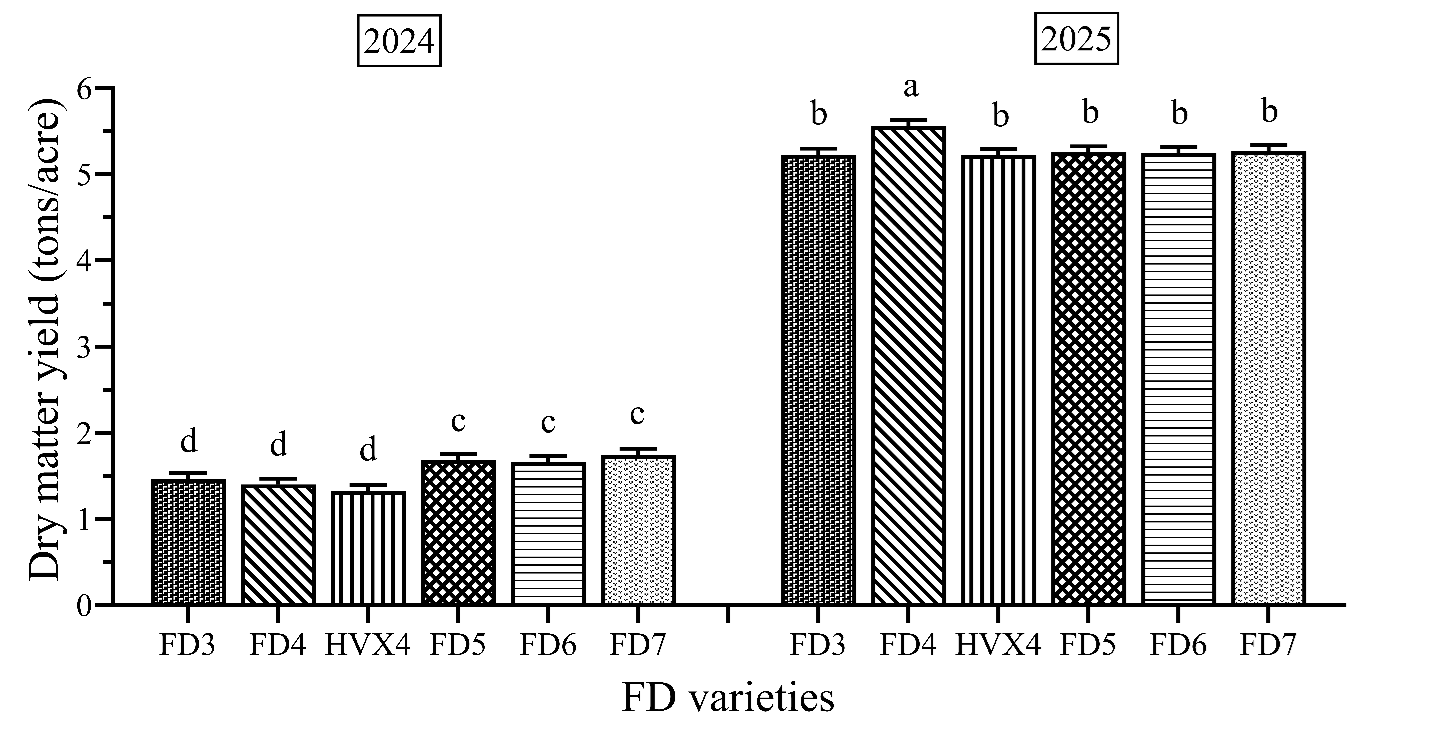
Figure 2. Effect of fall dormancy (FD) varieties on dry matter yield, averaged across cutting schedules and cutting events in 2024-2025. Same letter assignment denotes non-significance across varieties and years at α=0.05.
Acknowledgments
We thank farm operations staff J. Penney and A. Goodman, without whom this research could not be successful. We also acknowledge E. Benson, T. Burkhart, J. Cain, A. Mathison, and E. Schreifels for their assistance with field operations, data collection, and sample processing. This study was supported by the USDA National Institute of Food and Agriculture.