Evaluation of Urea-Potasium Chloride Blend and Residue Management in Spring Wheat
Dr. Olga Walsh, Principal Investigator, Western Triangle Agricultural Research Center (WTARC)
Objectives:
-
To compare N use efficiency of urea and KCL-amended urea
-
To evaluate the effect of residue removal on N loss, and
-
To assess the effect of side-banding vs soil-applied N, for spring wheat grown under dryland no-till conditions in Montana
Materials and Methods:
Two dryland experimental sites were established in Montana in the cooperating wheat producers’ fields (Fauque and Rouns). Choteau, red hard spring wheat was planted at 60 lb/ac pure live seed (PLS) - seeding rate recommended for spring wheat in Montana. The plot size was 5 by 25 feet, with 5 crop rows in each plot (12 in row spacing). The treatment structure is summarized in Table 1.
Table 1. Treatment structure.
|
Treatment |
Target N rate: N ha-1 |
Fertilizer sources |
Fertilizer placement |
Residue management |
|
1 |
0 |
- |
- |
undisturbed |
|
2 |
0 |
- |
- |
removed |
|
3 |
120 |
urea |
broadcasted |
undisturbed |
|
4 |
120 |
urea |
side-banded |
undisturbed |
|
5 |
120 |
urea |
broadcasted |
removed |
|
6 |
120 |
urea |
side-banded |
removed |
|
7 |
240 |
urea |
broadcasted |
undisturbed |
|
8 |
240 |
urea |
side-banded |
undisturbed |
|
9 |
240 |
urea |
broadcasted |
removed |
|
10 |
240 |
urea |
side-banded |
removed |
|
11 |
120 |
urea + KCl |
broadcasted |
undisturbed |
|
12 |
120 |
urea + KCl |
side-banded |
undisturbed |
|
13 |
120 |
urea + KCl |
broadcasted |
removed |
|
14 |
120 |
urea + KCl |
side-banded |
removed |
|
15 |
240 |
urea + KCl |
broadcasted |
undisturbed |
|
16 |
240 |
urea + KCl |
side-banded |
undisturbed |
|
17 |
240 |
urea + KCl |
broadcasted |
removed |
|
18 |
240 |
urea + KCl |
side-banded |
removed |
Treatments were arranged in a Randomized Complete Block Design with 4 replications. The study was established in the fields under dryland no-till conditions with very low to low residual soil N. Treatments 2, 5, 6, 9,10, 13, 14, 17 and 18 were mowed using a grass mower and the residue will be removed from the plots using a hay rake. Residue was left to remain undisturbed in the rest of the plots. Treatments 1 and 2 were established as unfertilized check plots. According to treatment structure, fertilizer N was applied as urea (46-0-0) or as a urea/KCL 50%-50% blend at planting to achieve 2 target N rates – 120 and 240 lb N/ac. The urea and urea-KCl blend were applied either in a side-band with the seed or broadcasted. The amount of residual N determined from the soil test N was credited for calculation of the application N rates. Phosphorus and other plant nutrients were applied according to current Montana State University guidelines for spring wheat. Pest and weed control was carried out throughout the growing season as necessary to ensure high quality of collected data. At tillering (Feekes 5) whole plant biomass samples were collected, weight to determine biomass weight and analyzed for total N content. Additionally, the Normalized Difference Vegetative Index (NDVI) readings from each experimental plot were collected at Feekes 5 growth stage. Feekes 5 has been identified in a course of multiple field studies as the most appropriate sensing time for wheat because it provides reliable prediction of both N uptake and biomass. The effects of N rate, KCL application, fertilizer placement, and residue management on spring wheat grain yield, test weight, grain protein, biomass production (weight), and biomass content were assessed. The analysis of variance was conducted using the PROC GLM procedure in SAS v9.4 (SAS Institute, Inc., Cary, N.C.). Mean separation was performed using the Orthogonal Contrasts method at a significance level of 0.05.
5. Project Results and Relevancy to Montana
This report summarizes results from 2 locations from 1 growing season. Grain yields ranged between
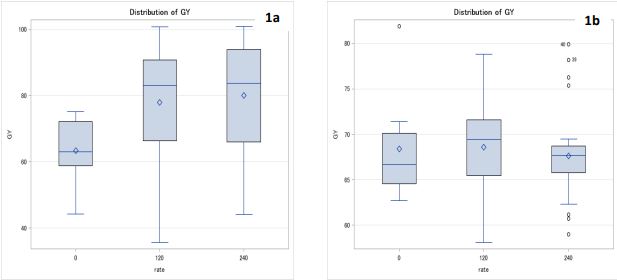
59.5 and 87.2 bu/a at Fauque and between 63.4 and 75.3 bu/a at Rouns in 2014 (Tables 2 and 3). The best treatment at Fauque was trt 14 – urea applied at 120 lb N/a rate with KCl in a side-band, with residue removed. Supplying N at the rate of 240 lb/a in a sideband, with undisturbed residue (trt 8), and application of urea+KCl side-banded with removed residue (trt 18) were also superior yield-wise, at Fauque. At Rounds, trt 10 (240 lb N/a rate of urea side-banded, with residue removed) was top- yielding, followed by trt 14 - urea applied at 120 lb N/a rate with KCl in a side-band, with residue removed. A much more apparent response to N fertilizer was noted at Fauque compared to Rouns (Figure 1).The rate of N has significantly (p>0.05) affected spring wheat grain yields at Fauque, but not at Rouns (Table 4).
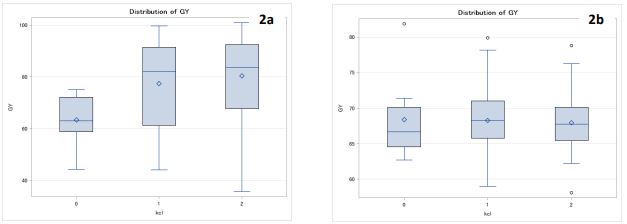
Similarly, application of KCl with urea (compared to urea alone) has produced superior yields at Fauque, but not at Rouns (Figure 2; Table 4). No statistically significant differences in grain yield associated with KCl application were observed at Rouns. At Fauque, application of KCl has resulted in the average yield of 80.4 bu/a, compared to 77.5 bu/a with urea alone.
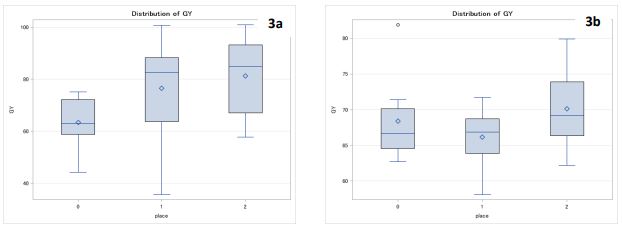
Fertilizer placement has significantly affected grain yields at both sites: side-banging fertilizer has resulted in superior yields compared to broadcasting (Figure 3; Table 4). Specifically, at Fauque, on average, broadcasting yielded 76.6 bu/a and side-banding – 81.3 bu/a. Similarly, at Rouns, broadcasting yielded 66.1 bu/a, and side-banding – 70.1 bu/a.
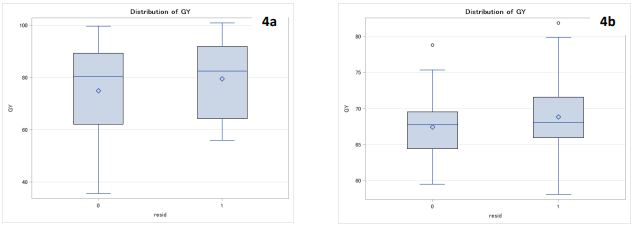
Although the differences in yield associated with the residue management were not statistically significant (p>0.05), removing residue produced higher yields at both locations (Figure 4; Table 4). At Fauque, the undisturbed plots yielded 74.9 bu/a, on average, compared to 79.5 bu/a yielded by plots with removed residue. Similarly, at Rouns, the plots with undisturbed residue yielded 67.4 bu/a compared to 68.9 bu/a – by plots with removed residue.
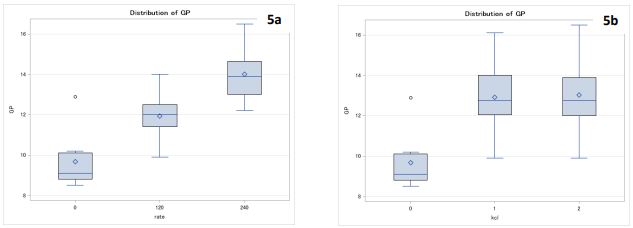
Test weights ranged from 53.2 to 55.1 lb/bu at Rouns, which was lower compared to 54.5 to 58.5 lb/bu at Fauque (Tables 2 and 3). Test weights were significantly (p>0.05) affected by the amount of supplied N at both sites (Table 4). Other treatments (application of KCl, fertilizer placement, residue management) did not significantly affect test weights at any of the two locations (Table 4). Grain protein values ranged from 9.2 to 14.6% at Fauque and 13.5 to 15.3% at Rouns (Tables 2 and 3). Total amount of supplied N has significantly (p>0.05) affected grain protein content at both sites (Figure 5; Table 4). Specifically, at Fauque, the plots receiving 120 lb N/a averaged 11.9% protein compared to 14.0% with 240 lb N/a. At Rouns, 14.6% was noted for 120 lb N/a rate vs 14.9 – for 240 lb N/a.
Grain protein values were also significantly affected by application of KCl, but only at Fauque site (12.9% without KCl vs 13.0% with KCl).
Fertilizer placement had a significant (p>0.05) effect on grain protein content at both locations (Table 4) - side-banding produced superior grain protein values compared to broadcasting. Side-banding averaged 13.1% vs 12.8% for broadcasting at Fauque; at Rouns, side-banding produced 14.9% protein compared to 14.6% noted for broadcasting. Virtually the same grain protein contents were observed for the two residue management treatments – no significant differences in protein values were associated with undisturbed vs removed residue treatments (Table 4).
Biomass weight and biomass total N content is reported in Tables 2 and 3 for both sites. At both sites, biomass weight has been significantly affected by KCL application and fertilizer placement. Increasing N rate from 120 to 240 lb N/a has not resulted in higher biomass production (Table 4 Side- banding resulted in higher biomass weights compared to broadcasting at both sites. Residue management had no significant effect on biomass production at any of the two sites (Table 4).
At both sites, biomass total N content was statistically significantly higher with higher N application rate, and addition of KCL. Also, side-banding resulted in higher biomass total N values at both sites (Table 4). Similar trends were observed for NDVI at both sites: NDVI was higher with side-banding compared to broadcasting. Other treatments had no significant effect on HDVI values at any of the two sites (Table 4).
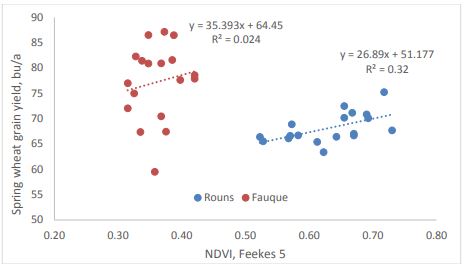
The NDVI values ranged from 0.32 to 0.42 at Fauque and from 0.52 to 0.73 at Rouns, corresponding with higher biomass weights and grain yields at Rouns locations (Tables 2 and 3). The correlation between NDVI as grain yield at Rouns (more responsive to N site) was much more pronounced compared to Fauque (Figure 6).
From the two site-years evaluated in this report, it appears that N amount and fertilizer placement have the strongest overall effect on spring wheat grain yield and protein content (Table 4). There was no consistent trend associated with application of KCl in this study, as positive effects of KCL addition were much more apparent at Fauque, compared to Rouns site. At Fauque, KCl application has affected yield, protein content, biomass production and its’ N content, while at Rouns, the KCl effects were concentrated on the biomass side (biomass weight and its’ total N). At both locations, removing residue from the plots has provided a slight advantage in grain yield, but not in grain protein content. Further research is necessary to verify these preliminary findings and to make conclusions in regards to the effects of KCl application, fertilizer placement and residue management in spring wheat. Also, further evaluation of NDVI usefulness as plant health assessment parameter needs to continue. It is recommended to repeat the experiment next growing season at three locations.
Table 2. Grain yield, test weight, protein content, biomass weight, biomass total N content, and NDVI, Fauque, 2014.
|
Trt |
Grain yield, bu/a |
Grain test weight, lb/bu |
Grain protein content, % |
Biomass weight, g |
Biomass total N, % |
NDVI |
|
1 |
59.5 |
57.8 |
10.2 |
9.1 |
4.2 |
0.36 |
|
2 |
67.4 |
58.5 |
9.2 |
12.3 |
4.2 |
0.38 |
|
3 |
67.4 |
57.1 |
11.5 |
6.5 |
4.5 |
0.34 |
|
4 |
78.6 |
56.8 |
12.3 |
12.0 |
4.6 |
0.42 |
|
5 |
80.9 |
58.2 |
11.4 |
7.0 |
4.6 |
0.37 |
|
6 |
77.9 |
56.9 |
12.4 |
8.5 |
4.6 |
0.42 |
|
7 |
77.0 |
56.1 |
13.8 |
6.8 |
4.7 |
0.32 |
|
8 |
86.5 |
55.8 |
13.9 |
6.4 |
4.8 |
0.39 |
|
9 |
70.5 |
54.5 |
14.4 |
6.2 |
4.4 |
0.37 |
|
10 |
81.4 |
56.7 |
13.7 |
8.4 |
5.0 |
0.34 |
|
11 |
72.1 |
58.2 |
11.7 |
11.7 |
4.5 |
0.32 |
|
12 |
77.7 |
57.0 |
12.3 |
10.8 |
4.7 |
0.40 |
|
13 |
81.6 |
57.8 |
12.0 |
23.1 |
4.2 |
0.39 |
|
14 |
87.2 |
57.7 |
12.0 |
9.4 |
4.8 |
0.37 |
|
15 |
80.9 |
56.4 |
13.8 |
18.5 |
4.7 |
0.35 |
|
16 |
75.0 |
55.5 |
14.6 |
15.1 |
4.7 |
0.33 |
|
17 |
82.3 |
56.6 |
14.0 |
15.4 |
4.8 |
0.33 |
|
18 |
86.5 |
56.7 |
13.9 |
14.7 |
5.0 |
0.35 |
Table 3. Grain yield, test weight, protein content, biomass weight, biomass total n content, and NDVI, Rouns, 2014.
|
Trt |
Grain yield, bu/a |
Grain test weight, lb/bu |
Grain protein content, % |
Biomass weight, g |
Biomass total N, % |
NDVI |
|
1 |
66.7 |
54.5 |
13.9 |
23.7 |
4.3 |
0.67 |
|
2 |
70.2 |
54.9 |
13.5 |
28.4 |
3.8 |
0.66 |
|
3 |
66.6 |
54.9 |
14.1 |
23.2 |
4.4 |
0.57 |
|
4 |
67.7 |
53.4 |
15.3 |
30.4 |
4.6 |
0.73 |
|
5 |
68.9 |
54.7 |
14.2 |
29.0 |
4.3 |
0.57 |
|
6 |
71.2 |
54.2 |
15.0 |
31.1 |
4.6 |
0.67 |
|
7 |
66.1 |
53.7 |
14.6 |
23.3 |
4.8 |
0.57 |
|
8 |
67.0 |
54.0 |
15.2 |
20.5 |
4.7 |
0.67 |
|
9 |
63.4 |
53.2 |
15.2 |
23.7 |
4.8 |
0.62 |
|
10 |
75.3 |
54.3 |
15.3 |
20.4 |
4.7 |
0.72 |
|
11 |
65.6 |
54.5 |
14.2 |
24.1 |
4.6 |
0.53 |
|
12 |
70.9 |
54.5 |
14.8 |
30.2 |
4.3 |
0.69 |
|
13 |
65.4 |
53.7 |
14.6 |
24.1 |
4.5 |
0.61 |
|
14 |
72.5 |
55.1 |
14.4 |
28.7 |
4.5 |
0.66 |
|
15 |
66.4 |
53.3 |
14.9 |
30.1 |
5.0 |
0.64 |
|
16 |
70.1 |
54.5 |
14.8 |
38.2 |
4.6 |
0.69 |
|
17 |
66.7 |
53.7 |
14.7 |
35.5 |
4.3 |
0.58 |
|
18 |
66.4 |
55.1 |
14.4 |
39.7 |
4.6 |
0.52 |
Figure 1. Effect of N rate (soil residual plus fertilizer) on spring wheat grain yield, Fauque (1a), and Rouns (1b), 2014.
Figure 2. Effect of KCL application on spring wheat grain yield, Fauque (2a), and Rouns (2b), 2014. On the X axis, 0 = no fertilizer; 1 = urea, no KCL; 2 = urea plus KCL.
Figure 3. Effect of fertilizer placement on spring wheat grain yield, Fauque (3a), and Rouns (3b), 2014. On the X axis, 0 = no fertilizer; 1 = broadcasted; 2 = side-banded.
Figure 4. Effect of residue management spring wheat grain yield, Fauque (4a), and Rouns (4b), 2014. On the X axis, 0 = undisturbed; 1 = removed.
Figure 5. Effect of N rate (soil residual plus fertilizer) on spring wheat grain protein content, Fauque (1a), and Rouns (1b), 2014.
Table 4. The summary of N rate, KCL application, fertilizer placement and residue management on spring wheat grain yield, test weight and grain protein content at Fauque and Rouns, 2014.
|
Parameter |
N rate |
KC L |
Fertilizer Placement |
Residue management |
|
Fauque |
||||
|
Grain yield |
* |
* |
** |
ns |
|
Test weight |
* |
ns |
ns |
ns |
|
Grain protein |
*** |
** |
*** |
ns |
|
Biomass weight |
ns |
*** |
ns |
ns |
|
Biomass total N |
** |
** |
*** |
ns |
|
NDVI |
ns |
ns |
* |
ns |
|
Rouns |
||||
|
Grain yield |
ns |
ns |
* |
ns |
|
Test weight |
* |
ns |
ns |
ns |
|
Grain protein |
*** |
ns |
*** |
ns |
|
Biomass weight |
ns |
* |
ns |
ns |
|
Biomass total N |
*** |
*** |
*** |
ns |
|
NDVI |
ns |
ns |
** |
ns |
*, **, and *** - significant, very significant, and highly significant effect; ns - no significance at 95% confidence level.
Figure 6. Relationship between NDVI (Feekes 5) and spring wheat grain yield, Fauque and Rouns, 2014.
Termination Date: September 2014.

