Improved pheromone based trapping systems for wheat stem sawfly (Cephus cinctus) using color and pheromone lures.
Principle of Investigators: Dr. Gadi V.P. Reddy1 and Dr. David K. Weaver2 Cooperators: Dr. Brian Thompson1, Dr. Sindhu Krishnankutty1
1Western Triangle Agricultural Research Center, Montana State University, 9546 Old Shelby Rd., P.O. Box 656, Conrad, MT 59425, USA
2Department of Land Resources & Environmental Sciences, Montana State University, 334 Leon Johnson Hall, Bozeman, MT 59717-3120
Background:
The wheat stem sawfly (Cephus cinctus) is one of the largest pests of wheat in Montana and the northern Great Plains in general. Sawfly cause damage to crops through yield reduction and yield loss due to interference with seed filling as a result of feeding on the plant and loss though direct cutting of the wheat stem during their pupation ritual. Cutting of wheat stems by sawfly (aka. lodging) results in wheat stem falling over where they may be missed by harvesting equipment (2012 approx. loss/ farmer = ~7 bushels/acre). In areas where sawfly are persistent many producers automatically implement procedures to reduce yield loss from lodging. This automatic practice is costly to the producers in time and materials. In recent, years this pest has expanded in range to areas south of it traditional range. In these new geographic regions and in its traditional range there is unpredictability in predicting the presence and magnitude of sawfly populations that hampers control measures.
C. cinctus distribution across the current geographic range is patchy. The density of populations varies from field to field and time to time. Uncertainty over where and when this pest occurs is expensive for land managers. Population controls, such as pesticides, rely on accurate information about when the pest is actively flying in the crop. The larvae of sawfly are not amenable to pesticide applications due to feeding internally concealed within the wheat stem. Therefore, accurate prediction of when the sawfly is actively flying in the crop is the best way to control this pest. A pheromone lure has been developed for C. cinctus, but optimal assessment of populations is not guaranteed with this lure alone.
Many herbivorous insects respond to colors. This type of phototaxis allows the herbivore to identify host plants for feeding or oviposition. In certain insects attraction toward a source of nectar, signified by the flower color, leads to a preferred food source. Sawfly adults are not known to feed. However adults may be preferentially attracted to particular colors due to innate characteristics of their biology. In this study we tested sawfly preference to pheromone baited colored traps to evaluate potential improvement to sawfly trapping systems.
Methods:
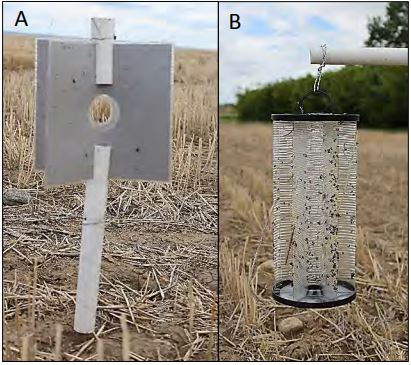
Sawfly traps consisted a combination of commercially produced insect traps and handmade colored panel traps. The three commercial traps were the white L P delta trap (Scentry), green and yellow bucket trap (Scentry) and the Bite Free Stable Fly trap (Starbar). There were eight colors for the sticky panel traps tested (white, yellow, red, blue, gray, black, purple and green). Panel traps consisted of laminated colored construction paper measuring approximately 8×8 inch squares. Two panels were laminated together for placement on the trap. PVC pipe held the two laminated sheets (4 panels) upright and separated. A hole in the middle of the sheets was affixed with the C. cinctus lure. Colored panels were coated with Tangle Trap prior to assembly.
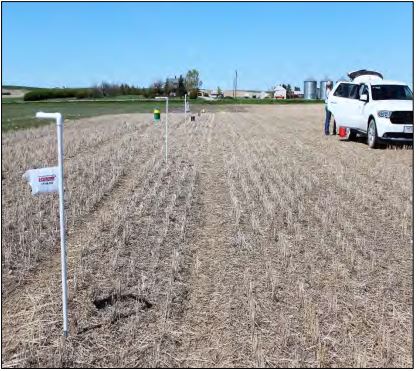
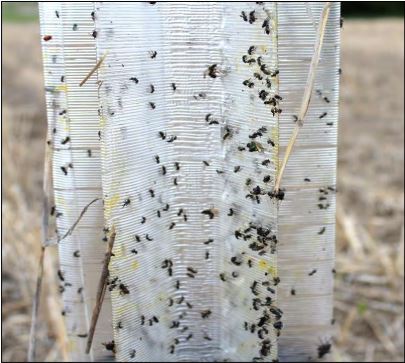
Assembled PVC traps were placed on staked or rebar driven into the ground in the field (Figure 1A). All commercial traps were fitted with pheromone bait and killing agent (bucket trap) prior to deployment in the field (Figure 1B). All traps were arranged 10m apart in a straight line at an equal height above the ground (Figure 2). Traps were placed in chemical fallow ten meters from the current crop of spring wheat. Trap lines were set up at three separate farms and at each farm 4 to 5 locations were trapped. Five locations were sample trapped at the Western Triangle Agricultural Research Center (48.306208, -111.925106), four locations were trapped at Kellog farm (48.042053, -111.978068) and 4 locations were trapped at the Meuli farm (48.261610, - 111.557256). Traps were monitored weekly for insect catches and were replaced midway through the study to refresh sticky surfaces (Figure 3). All bees and sawflies were collected and catalogued from the 5th of June to the 16th July.
The mean trap catch between traps was analyzed using Sigma Plot v13. Mean comparisons were made via ANOVA with a post hoc Tukey HSD test for multiple mean comparisons.
Results:
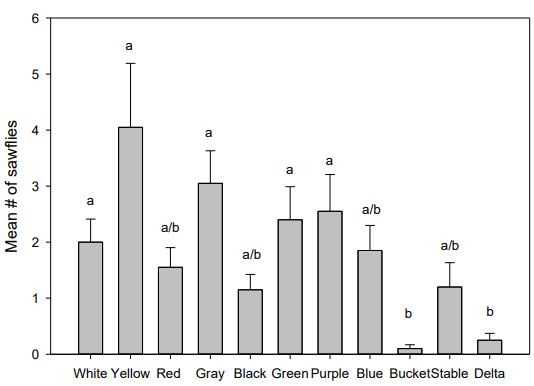
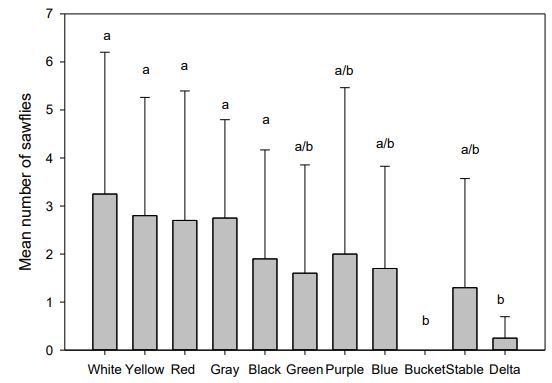
Traps caught sufficient numbers of sawflies for statistical analysis in all but the WTARC location. The colored traps did not differ in their mean trap catches from each other both the Meuli and the Kellog locations. Colored traps caught more sawflies than the bucket trap and the delta trap at both locations (Figures 4 & 5). Bucket and delta traps caught next to no sawflies over the course of the study. All other traps were not significantly different. The traps located at WTARC caught less than five sawflies over the course of the summer and was not analyzed for statistical comparisons.
Discussion:
Pheromone baits are suspected to be loaded at a reduced concentration due to uncharacteristically low sawfly catch at typically consistent trapping sites. The WTARC site is typically very good for sawfly populations. The low number of sawflies observed at WTARC in this study may be due to the presence of parasitoids, which were in abundance this summer. That this typically good site was very depopulated and that the other sites also exhibited low counts are indicative of the seasonal variation in sawfly populations, possibly due to parasitoid populations. Even so, yellow and white traps seem to catch more sawflies than the other colors. These colors offer the advantage that sawflies are easier to see on these traps than on the darker colors. Commercial traps were not effective in monitoring sawfly populations.
Acknowledgments:
This work was supported by Montana Wheat and Barley Committee and U.S. Department of Agriculture-National Institute of Food and Agriculture (USDA-NIFA) Hatch (#MONB00859). We also like to thank Steve Kellog (Brady, MT and Dan Meuli (Ledger, MT) for providing fields for our experiments.
Figure 1: Trap designs for A) handmade sticky panel traps and B) commercial Stable Fly trap.
Figure 2: Traps were arranged in a random order in a straight line immediately adjacent to the crop of spring wheat but at a minimum of 10m inside the fallow field.
Figure 3: Insect catch on stable fly trap.
Figure 4: Mean ± SE sawfly catch by each trap type at Kellog Farm. Letters differentiate significantly different trap catches (One-way ANNOVA followed by Tukey < 0.05). Each treatment is replicated four times.
Figure 5: Mean ± SE number of sawflies trapped at Meuli farm. Letters differentiate significantly different trap catches (One-way ANNOVA followed Tukey < 0.05). Each treatment is replicated four times.

