Plant Population and N Application Time for Improved Spring Wheat Production
Dr. Olga Walsh, Principal Investigator, Western Triangle Agricultural Research Center (WTARC)
Objectives:
-
To determine how late can N be applied to spring wheat without reducing grain yield and quality
-
To determine the most effective combination of seeding rate and N rate and application time for spring wheat dryland production system
Materials and Methods:
Two dryland experimental sites were established in Montana in the cooperating wheat producers’ fields (Martin and Orcutt). Choteau, red hard spring wheat was planted at 60 and 120 lb/ac pure live seed (PLS) - the recommended seeding rate for spring wheat in Montana (x1) and double the recommended rate (x2). The plot size was 5 by 25 feet, with 5 crop rows in each plot (12 in row spacing). At each location, a two-way factorial arrangement of treatments in a randomized complete block design with 3 replicates was utilized. The treatment structure is summarized in Table 1. Fertilizer N was applied as urea (46-0-0) at 4 rates ranging from 0 to 125 lb/ac. Four N fertilizer application times were evaluated: at seeding, or in-season - early tillering (Feekes 2-3), late tillering-beginning of jointing (Feekes 5-6), and flag leaf emergence (Feekes 8). The amount of phosphorus and other plant nutrients was applied according to current Montana State University guidelines for spring wheat. Pest and weed control was carried out throughout the growing season as necessary to ensure high quality of collected data. At grain maturity, within each plot, a subsample will be collected from two middle rows, by cutting the plants within 1 foot of row. At harvest, for each plot, grain yield and grain test weight were recorded, and grain samples were collected and analyzed for protein content. The effects of seeding rate, N rate, and N application time on spring wheat grain yield, test weight and protein content were assessed. The analysis of variance was conducted using the PROC GLM procedure in SAS v9.4 (SAS Institute, Inc., Cary, N.C.). Mean separation was performed using the Orthogonal Contrasts method at a significance level of 0.05.
Project Results and Relevancy to Montana
This report summarizes results from 2 locations from 1 growing season.
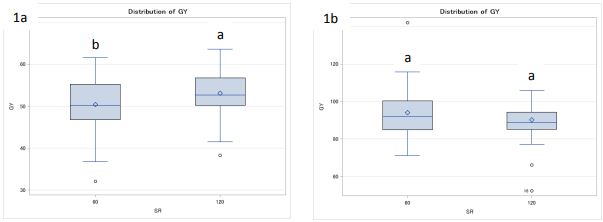
Figure 1. Effect of seeding rate on spring wheat grain yield, Martin (1a) and Orcutt (1b), 2014.
Spring wheat grain yields varied from 45.7 to 63.0 bu/a at Martin and from 77.0 to 103.7 bu/a at Orcutt (Table 1). Seeding rate of 120 lb/a PLS produced statistically significantly higher grain yield at Martin compared to 60 lb/a PLS. At Orcutt, similar yields were obtained with the two seeding rates (Figure 1).
Table 1. Treatment structure, spring wheat grain yield (GY), test weight (TW), and grain protein content (GP), Martin and Orcutt, 2014.
|
Trt |
Seeding rate, lb/ac (PLS) |
Fertilizer N rate, lb N/ac |
Fertilizer N application time |
Martin |
Orcutt |
||||
|
GY, bu/a |
TW, lb/bu |
GP, % |
GY, bu/a |
TW, lb/bu |
GP, % |
||||
|
1 |
60 |
0 |
n/a |
45.7 |
58.1 |
11.7 |
87.2 |
58.4 |
11.1 |
|
2 |
120 |
0 |
n/a |
45.9 |
56.7 |
12.6 |
81.6 |
59.7 |
10.6 |
|
3 |
60 |
25 |
at seeding |
48.2 |
55.1 |
13.0 |
92.7 |
59.4 |
11.3 |
|
4 |
120 |
25 |
at seeding |
55.7 |
56.2 |
12.6 |
77.0 |
58.5 |
10.8 |
|
5 |
60 |
75 |
at seeding |
49.6 |
55.1 |
13.9 |
88.1 |
59.0 |
11.5 |
|
6 |
120 |
75 |
at seeding |
52.8 |
55.1 |
13.8 |
89.0 |
57.8 |
12.6 |
|
7 |
60 |
125 |
at seeding |
49.4 |
55.6 |
14.2 |
98.1 |
57.6 |
13.2 |
|
8 |
120 |
125 |
at seeding |
53.6 |
54.9 |
14.4 |
96.5 |
56.9 |
13.7 |
|
9 |
60 |
25 |
early tillering |
49.7 |
57.3 |
12.3 |
99.5 |
59.0 |
11.5 |
|
10 |
120 |
25 |
early tillering |
51.8 |
58.1 |
11.4 |
90.1 |
59.2 |
10.7 |
|
11 |
60 |
75 |
early tillering |
53.1 |
57.6 |
12.3 |
98.8 |
59.0 |
12.5 |
|
12 |
120 |
75 |
early tillering |
52.6 |
55.9 |
13.5 |
98.4 |
59.0 |
12.5 |
|
13 |
60 |
125 |
early tillering |
52.9 |
57.0 |
13.8 |
103.7 |
59.4 |
13.3 |
|
14 |
120 |
125 |
early |
53.9 |
58.4 |
12.1 |
99.6 |
57.3 |
13.5 |
|
|
|
|
tillering |
|
|
|
|
|
|
|
15 |
60 |
25 |
late tillering |
53.8 |
57.7 |
12.1 |
97.0 |
59.1 |
11.2 |
|
16 |
120 |
25 |
late tillering |
54.3 |
57.6 |
12.1 |
91.7 |
59.3 |
10.9 |
|
17 |
60 |
75 |
late tillering |
53.6 |
56.9 |
13.2 |
88.5 |
58.8 |
11.9 |
|
18 |
120 |
75 |
late tillering |
54.6 |
55.5 |
13.5 |
93.8 |
59.1 |
12.1 |
|
19 |
60 |
125 |
late tillering |
55.0 |
57.6 |
12.8 |
97.6 |
59.2 |
13.0 |
|
20 |
120 |
125 |
late tillering |
63.0 |
54.8 |
14.8 |
94.9 |
59.2 |
12.8 |
|
21 |
60 |
25 |
flag leaf |
48.1 |
56.9 |
12.4 |
88.4 |
59.3 |
11.0 |
|
22 |
120 |
25 |
flag leaf |
48.3 |
58.3 |
11.4 |
83.8 |
59.3 |
10.6 |
|
23 |
60 |
75 |
flag leaf |
48.3 |
58.2 |
11.3 |
89.8 |
59.7 |
12.0 |
|
24 |
120 |
75 |
flag leaf |
53.1 |
56.9 |
13.1 |
88.0 |
58.7 |
11.5 |
|
25 |
60 |
125 |
flag leaf |
49.0 |
58.8 |
12.2 |
90.4 |
59.2 |
12.6 |
|
26 |
120 |
125 |
flag leaf |
51.3 |
59.7 |
12.5 |
87.2 |
58.6 |
11.8 |
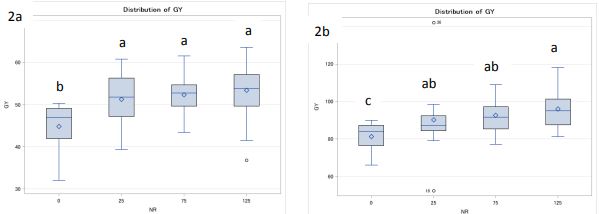
Grain yield was significantly affected by N application rates at both sites (Figure 2). At Martin, the lower yielding site, grain yield was increased from 45.8 for unfertilized check plot to 51.2 to 52.2 to 53.5 bu/a with application of 25, 75 and 125 lb N/a. The yields beyond the 25 lb N/a rate were not statistically different. At the high-yielding site, Orcutt, grain yields responded to N application up to 125 lb N/a (Figure 1); the response resulted in a 11.6 bu/a difference between the unfertilized check plot and the highest fertilized treatment.
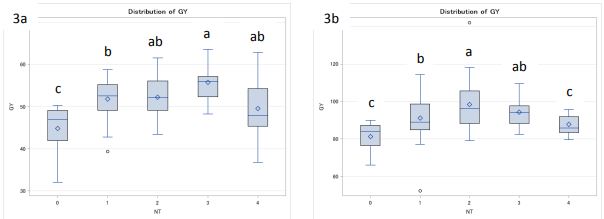
At both sites, application of N at seeding has produced the lowest grain yields, which were statistically significantly superior to other treatments (Figure 3). At both sites, fertilization at tillering resulted in best yields. At Orcutt, yield was increased by 8.9 bu/a by application at early tillering compared to at-seeding (from 90.2 to 98.4 bu/a); late tillering application reduced yields by 4.9 bu/a (to 93.9 bu/a), and N application at flag leaf emergence resulted in further yield decline of 6.0 bu/a (to 87.9 bu/a) (Figure 3). At Martin, best yield of 55.7 bu/a was achieved when N fertilization was delayed until late tillering, compared to 52.3 bu/a obtained with early tillering N fertilization, 51.6 bu/a – with at-seeding application, and 49.7 bu/a – with fertilization at flag leaf emergence (Figure 3).
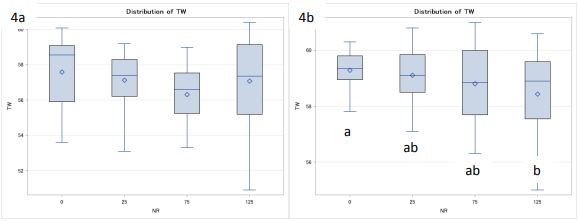
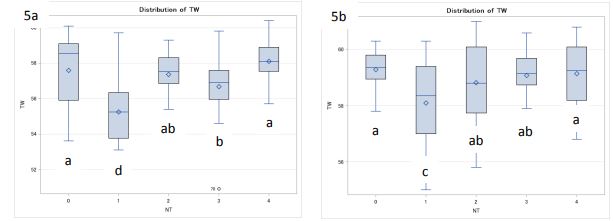
Test weight values ranged from 54.8 to 59.7 lb/bu at Martin and from 56.9 to 59.7 lb/bu at Orcutt (Table 1). No statistically significant differences in test weights associated with the seeding rate were observed at any of the two sites. At Martin, comparable test weights were obtained independent of N rate applied. At Orcutt, as N application rate increased, the test weight values decreased, as a side effect of increasing grain yields (Figure 4). At both sites, grain test weight values were higher for unfertilized check plots and for treatments fertilized at flag leaf emergence, associated with the lower yields for those treatments and production of fewer larger seeds (Figure 5).
Grain protein values varied from 11.3 to14.8 % at Martin and from 10.6 and 13.7 % at Orcutt (Table 1).
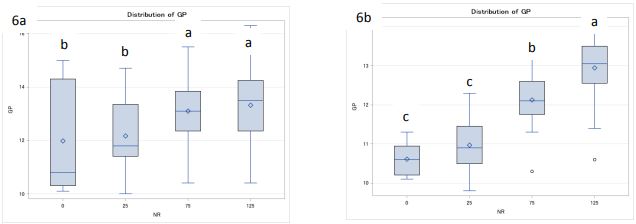
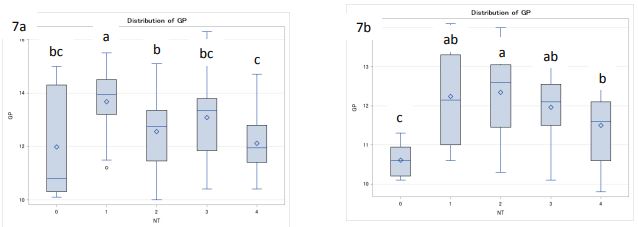
The seeding rate did not significantly affect the grain protein content at any of the two sites. Highest grain protein values were achieved with the highest N rate of 125 lb N/a at both sites. The protein values increased from 12.1 to 12.2 to 13.1 to 13.3 % at Martin and from 10.8 to 11.0 to 12.1 to 13.0
Figure 2. Effect of N rate on spring wheat grain yield, Martin (2a) and Orcutt (2b), 2014.
Figure 3. Effect of N application time on spring wheat grain yield, Martin (3a) and Orcutt (3b), 2014.
On the X axis: 0 = no N; 1 = at seeding; 2 = early tillering; 3 = late tillering; 4 = flag leaf.
Figure 4. Effect of N rate on spring wheat grain test weight, Martin (4a) and Orcutt (4b), 2014.
Figure 5. Effect of N application time on spring wheat grain test weight, Martin (5a) and Orcutt (5b), 2014.
Figure 6. Effect of N rate on spring wheat grain protein content, Martin (6a) and Orcutt (6b), 2014.
Figure 7. Effect of N application time on spring wheat grain protein content, Martin (7a) and Orcutt (7b), 2014.
On the X axis: 0 = no N; 1 = at seeding; 2 = early tillering; 3 = late tillering; 4 = flag leaf.
Overall, at a high yielding site, Orcutt, the best grain yield/protein combination was achieved with trt 13: seeding rate of 60 lb/a PLS, with N applied at 125 lb N/a at early tillering growth stage. At lower yielding site, Martin, trt 20 was the best treatment when considering both grain yield and quality – seeding rate of 120 lb/a PLS, with N applied at 125 lb N/a at late tillering/beginning stem elongation growth stage. These preliminary results indicate that early tillering to beginning of stem elongation (Feekes 2 through 6) is the optimum N fertilizer application time. Delaying fertilizer N applications in spring wheat is not recommended beyond Feekes 6 growth stage due to increased risk of yield and quality loss. Results strongly indicate that application of N at seeding is not advisable. It is recommended to repeat this study one more growing season at three locations to make more informed conclusions in regards to best seeding rate/N rate/N application time combinations in terms of both spring wheat grain yield and quality (test weigh and protein).
Termination Date: September 2014.

