Potassium Management for Improved Dryland Spring Wheat Grain Yield and Quality
Dr. Olga S. Walsh, Principle Investigator, Western Triangle Agricultural Research Center (WTARC), Conrad, MT 59425
Objectives:
-
To evaluate root characteristics and distribution on N uptake, as influenced by K fertilization, and
-
To determine optimum K fertilizer rate for improved grain yield and increased grain protein content in dryland hard red spring wheat.
Materials and Methods:
Two dryland experimental sites were established in Montana in the cooperating wheat producers’ fields – Christiaens and Orcutt. Choteau red hard spring wheat variety was planted at 60 lb/ac pure live seed (PLS) - seeding rate recommended for spring wheat in Montana. The plot size was 5 ft by 25 ft, with 5 crop rows in each plot (12 in row spacing). At each location, a two-way factorial arrangement of treatments in a randomized complete block design with 4 replicates was utilized. Fertilizer N was applied as urea (46-0-0) with the seed at planting at 7 rates ranging from 0 to 270 lb/ac. The amount of residual N determined from the preplant soil test N was credited for calculation of the application rates. Previous studies in Montana showed that maximum K accumulation in wheat occurs just after flowering, or mid heading and, unlike N and P, very little (less than 20 percent) of the accumulated K is used for grain fill. However, K deficiency early in the growing season has been shown to limit N uptake and compromise grain yield and protein (Jones et al., 2011). Therefore, K was applied as KCl (0-0-60) at 3 rates – 10, 20, and 30 lb K2O per ac side-banded at planting to ensure K supply early in the growing season. Phosphorus and other plant nutrients were applied according to current Montana State University guidelines for spring wheat. Pest and weed control was carried out throughout the growing season as necessary to ensure high quality of collected data.
At 3 anthesis, plant height was determined by measuring 5 randomly selected plants per plot. Whole plant biomass samples were collected from each plot. The above ground biomass of the harvested plants was combined to produce a composite biomass sample. The above ground biomass weight was determined; the subsamples were analyzed for N and K concentration. At harvest, for each plot grain yield and grain test weight will be recorded, and grain samples will be collected and send for comprehensive quality analysis, including total N, and grain protein content. Statistical analyses were carried out to evaluate the effect of K application rate on grain yield, and grain quality characteristics such as test weight, protein content were evaluated. The proposed root analysis was not carried out due to numerous failed attempts to excavate plants from the plots utilizing the tree stump removed without damaging a significant portions of the plots. Analysis of variance were conducted using the PROC GLM procedure in SAS v9.4 (SAS Institute, Inc., Cary, N.C.). Mean separation was performed using the Orthogonal Contrasts method at a significance levels of 0.05.
Project Results and Relevancy to Montana
Several N rates used in the study enabled us to evaluate a wide range of nutrient levels and the top rate of 270 lb of N/ac represented the N rate recommended for yield potential of spring wheat in the region. In 2014, Christiaens was a low-yielding site, compared to Orcutt. Yields at Christiaens ranged from 14.8 to 38.4 bu/a, and at Orcutt – from 87.2 to 110.9 bu/a (Tables 1 and 2).
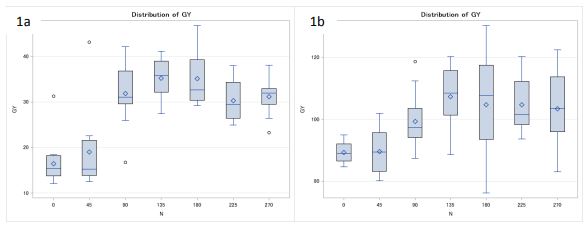
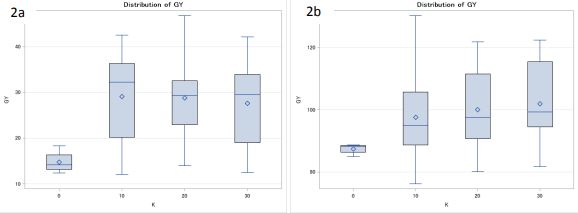
The amount of supplied N has significantly affected spring wheat grain yield at both locations (Figure 1, Table 3). At Christiaens, grain yields have increased from 19.0 to 31.9 to 35.2 bu/a with application of 45, 90, and 135 lb N/a; the yields reached plateau between 135 and 180 lb/a rate and then declined slightly to 30.3 and 31.2 bu/a at 225 and 270 lb N/a rates. At Orcutt, yields increased from 89.7 to 99.4 to 107.3 bu/a with 45, 90, and 135 lb N/a rates, the plateau of 104.7 bu/a was reached between 180 and 225 lb N/a rate, then declined slightly to 103.4 bu/a with 270 lb N/a. These findings illustrate the higher demand for N at a more responsive, higher yielding site. Grain yields responded to application of K at both sites. At Christiaens, the yields increased from 14.8 bu/a for no K trt (trt 1) to 15.4 bu/a for trt 2 (no N trt). Across N rates, application of 10 lb K2O resulted in 29.2 bu/a yield; doubling K rate to 20 lb K2O/a resulted in a slight yield decline to 28.8 bu/a; further increase to 30 lb K2O/a resulted in a further slight yield decrease to 27.6 bu/a (Figure 2). These differences were not statistically significant (p>0.05) (Table 3). At Orcutt site, averaged across N rates, yields were significantly increased from 97.6 to 100.0 to 102.0 bu/a by increasing K rates from 10 to 20 to 30 lb K2O/a (Figure 2). Trt 1 and trt 2 (unfertilized check plot and no N check) were not statistically significant at Orcutt site. At low-yielding Christiaens site, the best treatment combination of N and K was 180 lb N/a plus 10 lb K2O/a (trt 6). At higher-yielding Orcutt site, trt 19 was the best yield-wise – 135 lb N/a plus 30 lb K2O/a.
Test weights ranged from 57.3 to 58.3 lb/bu at Christiaens and from 52.1 to 57.0 at Orcutt (Tables 1 and 2). Test weights were and increased from 56.3 to 57.3 lb/bu at Christiaens and from 53.5 to 55.1 lb/bu by increasing K rate from 20 to 30 lb K2O/a at Orcutt. These differences were not statistically significant (Table 3). Test weights were similar for all N rates at Christiaens; test weights were significantly (p>0.05) affected by N rate at Orcutt (Table 3).
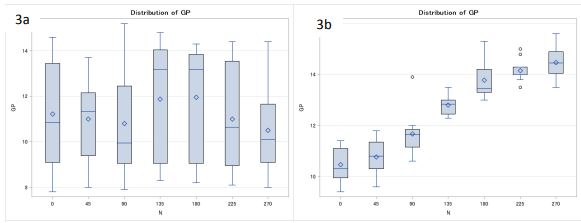
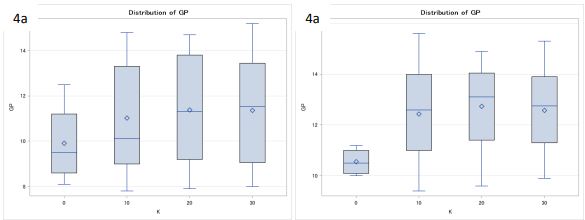
Grain protein values were varied from 9.2 to 13.0 % at Christiaens and from 10.1 to 14.9 % at Orcutt (tables 1 and 2). At Christiaens, grain protein content was not affected by supplied N amount (Figure 3; Table 3): protein values of 11.0, 10.8, 11.9, 12.0, 11.0, and 10.5 % were associated with the N rate incremental increase from 45 to 270 lb N/a. At Orcutt, grain protein values were significantly affected by the amount N: grain protein increased from 10.8 to 11.7 to 12.8 10 13.8 to 14.2 to 14.5 % when N rates increased in increments from 45 to 270 lb/N. Increasing K application rates from 0 to 10 to 20 lb K2O/a resulted in higher grain protein content values at both sites (Figure 4; Table 3); these differences were substantial but not statistically significant (p>0.05).
1. Treatment structure, grain yield, test weight, protein content, plant height, Christiaens, 2014
|
Trt |
Total N rate, lb/a |
K2O rate, lb/a |
Grain yield, bu/a |
Grain test weight, lb/bu |
Grain protein content, % |
Plant height, in |
Bio- mass weight, g |
Bio- mass total N, % |
Bio- mass total K, % |
|
1 |
0 |
0 |
14.8 |
57.7 |
9.9 |
26.5 |
51.1 |
0.92 |
0.81 |
|
2 |
0 |
10 |
15.4 |
56.0 |
11.2 |
33.0 |
74.8 |
0.89 |
0.83 |
|
3 |
45 |
10 |
16.0 |
56.6 |
10.4 |
24.7 |
40.9 |
1.08 |
0.74 |
|
4 |
90 |
10 |
33.5 |
56.6 |
10.1 |
27.0 |
48.0 |
0.72 |
1.01 |
|
5 |
135 |
10 |
35.6 |
56.3 |
11.6 |
28.8 |
57.9 |
1.24 |
0.80 |
|
6 |
180 |
10 |
38.4 |
55.6 |
11.3 |
31.9 |
65.8 |
1.22 |
0.99 |
|
7 |
225 |
10 |
32.2 |
57.1 |
11.2 |
28.1 |
65.7 |
1.23 |
0.86 |
|
8 |
270 |
10 |
33.0 |
56.0 |
11.4 |
27.9 |
48.0 |
1.34 |
1.12 |
|
9 |
0 |
20 |
20.4 |
56.6 |
11.1 |
27.5 |
57.5 |
0.95 |
0.80 |
|
10 |
45 |
20 |
25.3 |
57.3 |
11.6 |
33.6 |
83.4 |
0.83 |
0.78 |
|
11 |
90 |
20 |
28.2 |
57.3 |
10.7 |
27.7 |
48.8 |
0.82 |
0.92 |
|
12 |
135 |
20 |
35.1 |
56.4 |
13.0 |
27.1 |
47.2 |
1.09 |
0.87 |
|
13 |
180 |
20 |
36.7 |
58.0 |
12.6 |
27.7 |
54.5 |
1.21 |
0.98 |
|
14 |
225 |
20 |
26.7 |
57.2 |
9.9 |
26.7 |
44.3 |
1.48 |
1.02 |
|
15 |
270 |
20 |
29.5 |
58.3 |
10.9 |
32.2 |
72.0 |
1.55 |
1.07 |
|
16 |
0 |
30 |
15.3 |
57.0 |
12.7 |
30.1 |
62.4 |
0.85 |
0.70 |
|
17 |
45 |
30 |
15.7 |
57.0 |
11.0 |
28.8 |
55.1 |
0.87 |
0.72 |
|
18 |
90 |
30 |
34.0 |
56.7 |
11.7 |
28.7 |
55.8 |
1.01 |
0.77 |
|
19 |
135 |
30 |
35.0 |
55.2 |
11.1 |
28.6 |
50.4 |
1.02 |
0.92 |
|
20 |
180 |
30 |
30.4 |
55.8 |
12.0 |
33.0 |
74.1 |
1.57 |
1.16 |
|
21 |
225 |
30 |
32.1 |
56.6 |
12.0 |
32.3 |
72.2 |
1.24 |
1.12 |
|
22 |
270 |
30 |
31.0 |
57.3 |
9.2 |
30.8 |
65.2 |
1.51 |
0.88 |
Plant height and biomass weight in this study was not significantly affected by neither N nor K application rates (Tables 1, 2, and 3) at any of the two sites. Biomass total N content was significantly affected by N rate at both sites (Table 3). The rate of K had no statistically significant effect on biomass N content, although increasing K rate to 30 lb of K2O has slightly increased the total biomass N content at Orcutt.
Biomass total K content was significantly affected by N rate at Christiaens, but not at Orcutt. Biomass total N content was increased by increasing N rate up to 180 lb N/a at Christiaens; further increase in N rate has resulted in lower biomass total K values. Similar trend was observed up to the 90 lb N/a rate at Orcutt, but the differences in biomass total K content were not statistically significant; further increase of N rate beyond the 90 lb N/a has resulted in a notable decline in biomass total K values.
Table 2. Treatment structure, grain yield, test weight, protein content, plant height, Orcutt, 2014
|
Trt |
Total N rate, lb/a |
K2O rate, lb/a |
Grain yield, bu/a |
Grain test weight, lb/bu |
Grain protein content, % |
Plant height, in |
Bio- mass weight, g |
Bio- mass total N, % |
Bio- mass total K, % |
|
1 |
0 |
0 |
87.5 |
56.8 |
10.6 |
62.1 |
200.2 |
1.14 |
1.08 |
|
2 |
0 |
10 |
87.2 |
56.2 |
10.1 |
63.1 |
204.5 |
1.10 |
1.12 |
|
3 |
45 |
10 |
88.8 |
53.0 |
10.8 |
53.0 |
156.4 |
1.26 |
1.15 |
|
4 |
90 |
10 |
93.3 |
55.2 |
11.0 |
62.5 |
201.8 |
1.35 |
1.38 |
|
5 |
135 |
10 |
101.5 |
52.1 |
12.6 |
61.5 |
191.7 |
1.18 |
1.44 |
|
6 |
180 |
10 |
105.9 |
52.3 |
13.3 |
57.4 |
173.9 |
1.37 |
1.44 |
|
7 |
225 |
10 |
101.3 |
53.0 |
14.5 |
58.9 |
184.9 |
1.46 |
1.44 |
|
8 |
270 |
10 |
105.3 |
52.7 |
14.9 |
54.6 |
158.3 |
1.62 |
1.28 |
|
9 |
0 |
20 |
92.2 |
56.9 |
10.7 |
55.5 |
169.1 |
1.10 |
1.01 |
|
10 |
45 |
20 |
90.2 |
57.0 |
10.7 |
60.5 |
201.5 |
1.33 |
1.15 |
|
11 |
90 |
20 |
101.0 |
55.3 |
12.2 |
53.2 |
150.3 |
1.14 |
1.31 |
|
12 |
135 |
20 |
109.6 |
55.6 |
13.1 |
53.5 |
148.6 |
1.54 |
1.30 |
|
13 |
180 |
20 |
102.1 |
53.9 |
14.0 |
55.4 |
158.1 |
1.74 |
1.31 |
|
14 |
225 |
20 |
109.5 |
54.8 |
14.0 |
59.3 |
178.9 |
1.47 |
1.48 |
|
15 |
270 |
20 |
95.7 |
52.5 |
14.5 |
61.2 |
197.4 |
1.57 |
1.34 |
|
16 |
0 |
30 |
90.5 |
52.9 |
10.6 |
55.6 |
164.6 |
1.35 |
1.00 |
|
17 |
45 |
30 |
90.1 |
53.7 |
10.8 |
54.8 |
159.3 |
1.00 |
1.35 |
|
18 |
90 |
30 |
103.8 |
53.3 |
11.8 |
56.0 |
168.7 |
1.31 |
1.30 |
|
19 |
135 |
30 |
110.9 |
56.4 |
12.7 |
60.0 |
194.1 |
1.48 |
1.00 |
|
20 |
180 |
30 |
106.2 |
53.4 |
14.1 |
56.6 |
177.7 |
1.69 |
1.14 |
|
21 |
225 |
30 |
103.4 |
54.4 |
14.1 |
61.7 |
202.9 |
1.58 |
1.30 |
|
22 |
270 |
30 |
109.1 |
54.9 |
14.0 |
51.6 |
141.9 |
1.66 |
1.25 |
Figure 1. Effect of N rate (soil residual plus fertilizer) on spring wheat grain yield, Christiaens (1a), and Orcutt (1b), 2014.
Figure 2. Effect of K2O rate on spring wheat grain yield, Christiaens (2a), and Orcutt (2b), 2014.
Figure 3. Effect of N rate (soil residual plus fertilizer) on grain protein content, Christiaens (3a), and Orcutt (3b), 2014.
Figure 4. Effect of K2O rate on grain protein content, Christiaens (4a), and Orcutt (4b), 2014.
Table 3. The summary of N rate, KCL application, fertilizer placement and residue management on spring wheat grain yield, test weight, rain protein content, plant height, biomass weight, biomass total n and K content, Fauque and Rouns, 2014.
|
Parameter |
N rate |
K2O rate |
|
Christiaens |
||
|
Grain yield |
*** |
ns |
|
Test weight |
ns |
ns |
|
Grain protein |
ns |
ns |
|
Plant height |
ns |
ns |
|
Biomass weight |
ns |
ns |
|
Biomass total N |
** |
ns |
|
Biomass total K |
ns |
ns |
|
Orcutt |
||
|
Grain yield |
*** |
* |
|
Test weight |
* |
ns |
|
Grain protein |
*** |
ns |
|
Plant height |
ns |
ns |
|
Biomass weight |
ns |
ns |
|
Biomass total N |
*** |
ns |
|
Biomass total K |
ns |
ns |
*, **, and *** designate significant, very significant, and highly significant effect; ns designates no significance at 95% confidence level.
Summary of preliminary conclusions:
The result of the evaluated two site years suggest that application of K fertilizer at the rate of 10 to 20 lb K2O/a may have the potential to improve grain yield and increase grain protein content in dryland hard red spring wheat in Montana. In this study, grain yield was increased by approximately 5 bu/a with K fertilization at a higher yielding site. The positive results from K application are likely to be more pronounced in higher yield potential areas. It is recommended to repeat this study for one more growing season at three locations to verify the first year’s results. The root sampling method must be refined in order to obtain good quality root data. It is suggested that a soil auger is used to extract the root samples within the rows and between the rows to get a comprehensive picture of root biomass and root characteristics.
Termination Date: September 2014.


