Agronomy and Soil Nutrient Management Program
During the spring and winter cropping seasons of 2015, the Agronomy and Nutrient Management Program conducted four experiments in the fields of study of nitrogen and water use efficiencies, fertilizer management, pulse-cereal cropping systems, and soil salinity.
STUDY 1: Varietal nitrogen and water use efficiency differences in two Montana cropping systems
Principal Investigators: Dr Olga Walsh; Dr Roger Ondoua, Western Triangle Agricultural Research Center.
Collaborators: John H. Miller, Research Associate; Debra Miller, Research Assistant, Western Triangle Agricultural Research Center.
Farmer Cooperators: Cory Crawford (Valier, MT); Aklestead (Devon, MT)
-
-
Objective: this study aimed at evaluating both nitrogen and water use efficiencies of five varieties of spring wheat (Vida, Duclair, O’Neal; WB9668; and Fortuna) as related to two Montana cropping systems, Continuous Cropping, and Crop-Fallow.
-
Methods: the experiment was conducted in the spring 2015 at two locations of the Montana Western Triangle, Valier and Devon. At each location, the experimental site included two adjacent fields, one of which was a spring wheat fallow, and the other a recently-cropped field. The experimental design was a split-split-plot in a randomized complete block design with four repetitions. The main plot factor was cropping system with two levels (Fallow-crop, Continuous Cropping), the sub-plot factor was spring wheat variety with five levels, and the sub-sub-plot factor was nitrogen rate with four levels (0; 40; 80; and 120 lbs N/ac).
-
Results
This study successfully determined that:
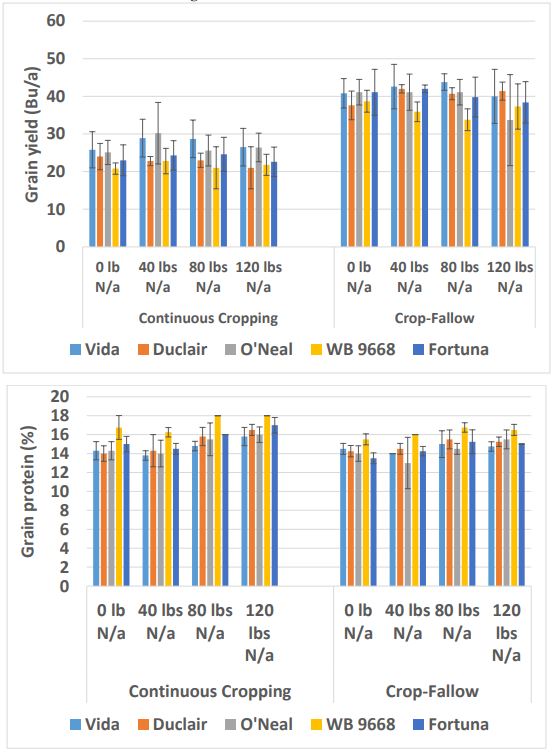
-The crop-fallow cropping system out yielded the wheat-wheat continuous system by 67% when the average annual precipitation in the preceding (2014) and the growing year (2015) was less than 14” (Figure 1).
-
The spring wheat variety Vida was the most stable across various levels of soil fertility and cropping systems with respect to grain yield.
-
The spring wheat variety WB9668 consistently had the highest protein content across various levels of soil fertility and the two cropping systems evaluated (Figure 2).
Unfortunately this study had some setbacks as well. The initial principal investigator Dr Olga Walsh left Montana State University in the fall of 2014, before the implementation of the experiment. A new agronomist, Dr Roger Ondoua, was hired in July 2015. The project was solely implemented by two technicians, and as a result, experimental sites with low residual nitrogen were not selected, and precipitation and moisture data were improperly recorded. We could not use these data to scientifically estimate nitrogen and water use efficiencies of the various varieties under the two cropping systems evaluated.
Research Follow up
The objectives of this study were partially attained due to reasons mentioned above. A second year of this study is scheduled in the spring 2016 under the supervision of the new MSU agronomist Dr Roger Ondoua (Grant 27143). To offset for the 2015 missing data, the number of locations shall be increased from two to four; and science-grade rain-gauges and lysimeter tubes will be installed at each location, and in each plot in order to calculate water balance, and therefore water use efficiency. The four on-farm experimental sites will be selected based on their reported low residual nitrate in order to increase the likelihood of nitrogen response, which in turn will allow proper estimation of nitrogen use efficiency.
-
-
-
Figure 1: Effect of cropping system, N rate, and cultivar on grain yield of 5 spring wheat varieties grown in Valier and Devon.
Figure 2: Effect of cropping system, N rate, and cultivar on grain protein of 5 spring wheat varieties grown in Valier and Devon.
Project Potential Outcomes
Pending confirmation following the second year of study, some important guidelines can already be anticipated for the farmers in the Golden Triangle of Montana.
-
The spring wheat cultivar Vida appears to be the most stable grain yield-wise under variable conditions of soil fertility and soil water storage (34 Bu/a; 15% protein).
-
The spring wheat WB9668 produces the highest protein yield under variable conditions of soil fertility and soil water storage (17%; 29 Bu/a).\
-
Practically, depending on the price of protein premiums, Montana farmers may have to choose between Vida and WB 9668.
STUDY 2: Potassium management for improved dryland spring wheat grain yield and quality
-
-
Objective: This was a collaborative study between The Western Triangle Agricultural Research Center (Dr Roger Ondoua), the Northern Agricultural Research Center (Dr. Kefyalew G Desta), and the North Western Agricultural Research Center (Dr. Jessica Torrion). The objective was to determine the optimum K2O fertilizer rate for improved grain yield and increased grain protein content in dryland hard red spring wheat.
-
Methods: The study was conducted at four sites in 2014 and 2015 thanks to the collaboration of four farmer cooperators: Christiaens (Shelby, MT), G. Orcutt (Conrad, MT), D. Rouns (Brady, MT), and K. Fauque (Sunburst, MT). Choteau red hard spring wheat variety was planted at 60 lb/ac pure live seed (PLS) - seeding rate recommended for spring wheat in Montana. At each location, a two-way factorial arrangement (factorial combinations of N x K2O rates plus a control treatment outside the factorial) of treatments in a randomized complete block design with four replications was utilized. Fertilizer N was side-banded as urea (46-0-0) with the seed at planting at seven rates (0, 45, 90 135, 180, 225 and 270 lb/ac) in 2014 and five rates (0, 45, 90 180, 270 lb/ac) in 2015. The amount of residual N determined from the pre-plant soil test N was credited for calculation of the application rates.
-
Results:
-
2014 CROPPING SEASON
In 2014, Christiaens’ field (Shelby, MT) was a low-yielding site, compared to Orcutt (Conrad, MT). Yields at Christiaens ranged from 14.8 to 38.4 bu/ac, and at Orcutt – from 87.2 to 110.9 bu/ac (Tables 1 and 2).
Table 1. Treatments, and mean grain yield, test weight, protein content, biomass N and biomass K at Christiaens, Shelby, MT, 2014.
Trt
#
N rate,
lb/ac
K2O
rate, lb/ac
Grain yield,
bu/ac
Grain test
weight, lb/bu
Grain
protein content,
%
Biomass
total N, %
Biomass
total K, %
1
0
0
14.8
57.7
9.9
0.92
0.81
2
0
10
15.4
56.0
11.2
0.89
0.83
3
45
10
16.0
56.6
10.4
1.08
0.74
4
90
10
33.5
56.6
10.1
0.72
1.01
5
135
10
35.6
56.3
11.6
1.24
0.80
6
180
10
38.4
55.6
11.3
1.22
0.99
7
225
10
32.2
57.1
11.2
1.23
0.86
8
270
10
33.0
56.0
11.4
1.34
1.12
9
0
20
20.4
56.6
11.1
0.95
0.80
10
45
20
25.3
57.3
11.6
0.83
0.78
11
90
20
28.2
57.3
10.7
0.82
0.92
12
135
20
35.1
56.4
13.0
1.09
0.87
13
180
20
36.7
58.0
12.6
1.21
0.98
14
225
20
26.7
57.2
9.9
1.48
1.02
15
270
20
29.5
58.3
10.9
1.55
1.07
16
0
30
15.3
57.0
12.7
0.85
0.70
17
45
30
15.7
57.0
11.0
0.87
0.72
18
90
30
34.0
56.7
11.7
1.01
0.77
19
135
30
35.0
55.2
11.1
1.02
0.92
20
180
30
30.4
55.8
12.0
1.57
1.16
21
225
30
32.1
56.6
12.0
1.24
1.12
22
270
30
31.0
57.3
9.2
1.51
0.88
Table 2. Treatments, and mean grain yield, test weight, protein content, biomass N and biomass K at Orcutt, Conrad, in 2014.
Trt
#
N rate,
lb/ac
K2O
rate, lb/ac
Grain yield,
bu/ac
Grain test
weight, lb/bu
Grain protein
Content (%)
Bio-mass
total N (%)
Bio-mass
total K (%)
1
0
0
87.5
56.8
10.6
1.14
1.08
2
0
10
87.2
56.2
10.1
1.10
1.12
3
45
10
88.8
53.0
10.8
1.26
1.15
4
90
10
93.3
55.2
11.0
1.35
1.38
5
135
10
101.5
52.1
12.6
1.18
1.44
6
180
10
105.9
52.3
13.3
1.37
1.44
7
225
10
101.3
53.0
14.5
1.46
1.44
8
270
10
105.3
52.7
14.9
1.62
1.28
9
0
20
92.2
56.9
10.7
1.10
1.01
10
45
20
90.2
57.0
10.7
1.33
1.15
11
90
20
101.0
55.3
12.2
1.14
1.31
12
135
20
109.6
55.6
13.1
1.54
1.30
13
180
20
102.1
53.9
14.0
1.74
1.31
14
225
20
109.5
54.8
14.0
1.47
1.48
15
270
20
95.7
52.5
14.5
1.57
1.34
16
0
30
90.5
52.9
10.6
1.35
1.00
17
45
30
90.1
53.7
10.8
1.00
1.35
18
90
30
103.8
53.3
11.8
1.31
1.30
19
135
30
110.9
56.4
12.7
1.48
1.00
20
180
30
106.2
53.4
14.1
1.69
1.14
21
225
30
103.4
54.4
14.1
1.58
1.30
22
270
30
109.1
54.9
14.0
1.66
1.25
-
-
Generally, grain yield increased with increasing rates of available nitrogen up to a critical soil nitrogen concentration. Thus, at Christiaens (Shelby), grain yields increased from 16.5, with no nitrogen application, to 35.2 bu/ac with application of 135 lb N/ac; the yields reached plateau between 135 and 180 lb/ac rate and then declined slightly to 30.3 and 31.2 bu/ac at 225 and 270 lb N/ac rates. At Orcutt (Conrad), yields increased from 89.4 with no N to 107.3 bu/ac with 135 lb N/ac rates, the plateau of 104.7 bu/ac was reached between 180 and 225 lb N/ac, then declined slightly to 103.4 bu/ac with 270 lb N/ac.
With respect to the potassium factor, analysis of variances at both locations showed that there were no significant differences among potassium treatments for the variables grain yield, protein content, test weight, biomass total N and K (Table 3)
Table 3. Analysis of variance of the effect of N and K rates on spring wheat grain yield, protein content, test weight, biomass total N and K from two studies in Shelby and Conrad laid out as a factorial experiment in a completely randomized design.
|
N rate, lb/ac |
Christiaens (Shelby) |
||||
|
Grain yield, bu/ac |
Protein, % |
Test weight, lb/bu |
Biomass total N, % |
Biomass total k, % |
|
|
0 |
16.5 |
11.2 |
56.8 |
0.90 |
0.79 |
|
45 |
19.0 |
11.0 |
57.0 |
0.93 |
0.75 |
|
90 |
31.9 |
10.8 |
56.9 |
0.85 |
0.90 |
|
135 |
35.2 |
11.9 |
56.0 |
1.12 |
0.86 |
|
180 |
35.2 |
12.0 |
56.5 |
1.33 |
1.04 |
|
225 |
30.3 |
11.0 |
57.0 |
1.32 |
1.00 |
|
270 |
31.2 |
10.5 |
57.2 |
1.47 |
1.02 |
|
Prob>F |
*** |
ns |
ns |
** |
* |
|
Linear Trend |
*** |
- |
- |
*** |
- |
|
Quadratic Trend |
*** |
- |
- |
ns |
- |
|
K2O rate |
ns |
ns |
ns |
* |
* |
|
N x K2O rate |
ns |
ns |
ns |
ns |
ns |
|
|
Orcutt (Conrad) |
||||
|
N rate, lb/ac |
|
|
|
|
|
|
0 |
89.4 |
10.5 |
55.7 |
1.17 |
1.05 |
|
45 |
89.7 |
10.8 |
54.6 |
1.20 |
1.22 |
|
90 |
99.4 |
11.7 |
54.6 |
1.27 |
1.33 |
|
135 |
107.3 |
12.8 |
54.7 |
1.40 |
1.25 |
|
180 |
104.7 |
13.8 |
53.2 |
1.60 |
1.30 |
|
225 |
104.7 |
14.2 |
54.1 |
1.50 |
1.41 |
|
270 |
103.4 |
14.5 |
53.4 |
1.62 |
1.29 |
|
Prob>F |
*** |
*** |
ns |
*** |
ns |
|
Linear Trend |
*** |
*** |
- |
*** |
- |
|
Quadratic Trend |
** |
ns |
- |
ns |
- |
|
K2O rate |
ns |
ns |
ns |
ns |
ns |
|
N x K2O rate |
ns |
ns |
ns |
ns |
ns |
*, **, and *** designate significant, very significant, and highly significant effect; ns designates no significance at 95% confidence level.
-
-
-
2015 CROPPING SEASON
-
-
In 2015, the same study was repeated in Brady (Rouns’ field) and Sunburst (Fauque’s field). The results are presented in table 4
Table 4. Treatment means and significance of the of the effect of N and K rates on spring wheat grain yield, protein content, and test weight in Sunburst and Brady.
|
N rate, lb/ac |
K2O rate, lb/ac |
Grain yield, bu/ac |
Protein, % |
Test weight, lb/bu |
Grain yield, bu/ac |
Protein, % |
Test weight, lb/bu |
|
0 |
0 |
14.8 |
13.3 |
57.4 |
36.0 |
15.3 |
55.0 |
|
0 |
10 |
15.3 |
13.5 |
57.3 |
35.4 |
14.9 |
55.8 |
|
45 |
10 |
27.3 |
14.5 |
56.6 |
39.5 |
16.0 |
55.1 |
|
90 |
10 |
25.1 |
16.6 |
55.4 |
34.7 |
17.1 |
54.3 |
|
180 |
10 |
20.6 |
17.9 |
55.3 |
32.5 |
17.0 |
54.0 |
|
270 |
10 |
21.7 |
18.4 |
55.8 |
19.9 |
18.0 |
53.8 |
|
0 |
20 |
13.9 |
13.2 |
57.5 |
38.7 |
15.6 |
55.6 |
|
45 |
20 |
25.3 |
15.1 |
55.7 |
40.5 |
16.5 |
55.1 |
|
90 |
20 |
26.8 |
16.6 |
55.9 |
40.0 |
16.2 |
55.1 |
|
180 |
20 |
25.4 |
17.7 |
55.3 |
37.4 |
16.9 |
54.4 |
|
270 |
20 |
18.7 |
18.6 |
55.1 |
20.3 |
17.7 |
53.7 |
|
0 |
30 |
14.1 |
13.1 |
57.0 |
31.7 |
16.0 |
55.0 |
|
45 |
30 |
26.3 |
15.0 |
56.0 |
39.5 |
15.9 |
55.4 |
|
90 |
30 |
25.6 |
16.9 |
55.6 |
40.8 |
16.4 |
54.9 |
|
180 |
30 |
25.6 |
17.9 |
55.0 |
34.6 |
17.0 |
54.2 |
|
270 |
30 |
25.4 |
18.3 |
55.5 |
19.9 |
18.4 |
53.1 |
|
|
|
22.0 |
16.0 |
56.0 |
|
|
|
|
|
|
3.5 |
0.5 |
0.5 |
4.6 |
0.5 |
0.5 |
|
Prob>F |
|
*** |
*** |
*** |
*** |
*** |
*** |
*** designates highly significant overall treatments effect; ns designates no significance at 95% confidence level.
The analysis of variance performed on the factorial combinations of the five N rates and three K2O rates showed that N, unlike K, had a significant effect on all dependent variables. No significant N x K2O interaction was found. Grain yield had a quadratic trend with increase in N rates from 0 to 270 lb/ac at Fauque and Rouns. At both Fauque and Rouns grain yield has increased with an increase in N rate from 0 to 45 lb/ac and then decreased after that rate (quadratic estimate -29.1 and -41.0 at Fauque and Rouns, respectively). Whereas, grain protein and test weight had a linear relationship with increase in N rates. Grain protein linearly increased with increase in N rates from 140 to 270 lb/ac (estimate= 13.3 and 5.9 at Fauque and Rouns, respectively). Grain test weight decreased with increase in N rates from 0 to 270 lb/ac.
Significance of the Study
In this study it was hypothesized that the application of K2O along N might improve yield and quality of spring wheat. Results suggest that there was not consistent and statistically significant effect of K2O or N x K2O interaction effect on most of the measured variables. However, compared with no fertilizer, the application of K2O fertilizer at the rate of 10 to 20 lb K2O/ac may have the potential to improve grain yield and increase grain protein content in dryland hard red spring wheat in Montana. The positive results from K2O application are likely to be more pronounced in higher yield potential areas than low yield potential areas.
In 2015, the poor response to added K2O might be attributed to soil K content. From 2015 pre- plant samples, K contents at Fauque and Rouns was above 300 ppm. This amount can provide adequate K for the crop. Additionally, 2015 cropping season was characterized by sub-optimal growing conditions, mainly precipitation. The lack of consistent response to K2O fertilizer suggests that farmers need to monitor their field closely before investing on K fertilizer.
STUDY 3: Effect of soil water storage and evapotranspiration on total grain and protein yields of pea-winter wheat, lentil-winter wheat, and winter barley- wheat crop sequences.
Principal Investigators: Dr Roger Ondoua, Assistant Professor, Agronomy and Nutrient Management, MAES/Western Triangle Agricultural Research Center (WTARC).
Collaborator: Phillip Hammermeister, Research Assistant, Western Triangle Agricultural Research Center.
-
Objectives:
-
To determine grain and protein yield responses of pea-winter wheat, lentil- winter wheat, and barley-winter wheat sequences to soil water storage.
-
To determine the relationships between grain and protein yields of pea-winter wheat, lentil-winter wheat, and barley-winter wheat sequences and the independent variables soil moisture, in-season precipitations, and evapotranspiration.
-
To determine the relationships between grain and protein yields of pea-winter wheat, lentil-winter wheat, and barley-winter wheat sequences and the independent variables soil moisture, in-season precipitations, and evapotranspiration.
-
To study the profitability of pea-winter wheat, lentil-winter wheat, barley- winter wheat, winter wheat-fallow, and continuous winter wheat crop sequences under different scenarios of soil moisture.
-
-
Background and justification:
Primarily due to low annual quantity and poor distribution of precipitations, dryland crop production risk in Montana is high. Winter wheat-fallow agricultural systems have been widely adopted to reduce the risk of crop failure. However, reduced risk goes along with reduced profit potential. Intensification of the winter wheat-based cropping systems offers the potential for increased profitability while increasing farmer risk as well. This research project aims at improving the economic and environmental sustainability of croplands in the drylands of Montana through the intensification of winter wheat-pulse and winter wheat-barley cropping systems. This goal could be attained through cropping pulse or barley on 4.6 million acres of Montana lands left fallow between crops. Moreover, including pulse crops in a rotation has been shown to improve soil quality and nitrogen content, break pest and disease cycles.
The matter in issue is the perception that leaving land fallow (4.6 million acres) is required to store soil moisture rather than grow crops. This perception stems from cases of pulse failure across Montana attributed to severe atmospheric (solar radiation, heat, precipitations) and soil (moisture, temperature) climate conditions. A large proportion of pulse failure in Montana can be attributed to the year-to-year variation in climate. It is therefore of paramount importance to develop tools that would enable farmers to determine which year to skip fallow through the prediction with greater accuracy of responses of pea-winter wheat, lentil-winter wheat, and barley-winter wheat crop sequences to soil water storage a few months before the onset of the cropping season when most input management decision are made.
-
Methods:
At the Western Triangle Agricultural Research Center, we have successfully Fall-recharged and created a soil moisture gradient along a 400 x 100-feet field using a differential line irrigation method. Thus, five 55 x 100-feet blocks (soil moisture block) with average gravimetric soil moisture contents ranging from 8% (control-block with no supplemental recharge) to 40% were created through the 0-4 feet soil profile.
The treatments, laid out in a randomized complete block design, consist of five crop sequences: pea-winter wheat, lentil-winter wheat, barley-winter wheat, continuous winter wheat, and winter wheat-fallow. They will be repeated four times in each of the soil moisture block (Table 1). A sixth block will be summer-irrigated and will help normalize the yields recorded in the five recharge- blocks (relative yields) to allow assumptions and applicability of the results to differing locations and ecosystems. Individual plots, seeded on 12 inch spacing, are 5 x 25 ft in size. Field edge effects will be minimized by the seeding of border plots.
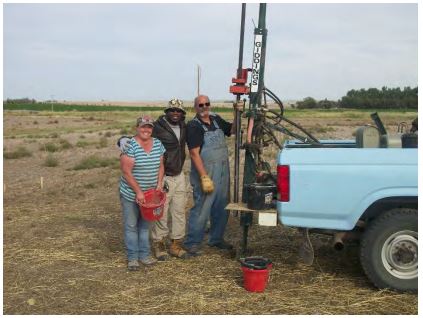
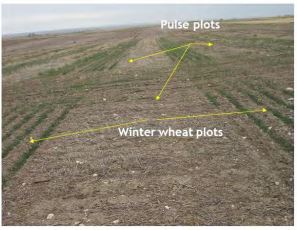
In September 2015, winter wheat plots destined for the two control crop sequences (continuous winter wheat, and winter wheat-fallow) were soil-sampled at 0-1; 1-2; 2-3; and 3-4 ft depth before they were seeded, and gravimetric soil moisture contents were determined along the 0-4 feet soil profile (Figure 1, Figure 2). In the spring of 2016, pea, lentil, and barley plots will be soil-sampled and gravimetric soil moisture contents determined prior to seeding. In Each plot, 2 soil moisture sensors (Spectrum Technologies, Inc., Aurora, IL) will be buried at 1 and 2 feet respectively to continuously record volumetric soil moistures and soil temperatures at these soil depths. Evapotranspiration gauges (Spectrum Technologies, Inc., Aurora, IL) will be installed on all plots to continuously monitor and record evapotranspiration occurring in each plot. Winter wheat will succeed spring barley, pea, and lentil in fall 2016 and the first cycle of the evaluation will complete in the summer of 2017. The second cycle of evaluation of the crop sequences will start in fall of 2017 with the second recharge of the five blocks. The treatment structure of the study is depicted on Table 1. In addition to the on-station experiment, the five crop sequences described above will be on farm-evaluated on larger plots (20 ft x 20 ft) in three farm cooperator fields located in HighWoods, Choteau, and Valier. The results will help in the validation of the response model obtained on-station.
Table 1. Treatment structure of the soil water storage and evapotranspiration experiment. Blocks of gravimetric soil moisture content (%) were artificially created through differential irrigation in the 1-4 ft soil profile. Crop sequences are laid in a randomized complete block design with four repetitions within each block. Average soil moisture contents of blocks ranged from 10 to 40% (gravimetric soil moisture content). B-WW; barley-winter wheat; P-WW: pea- winter wheat; L-WW: lentil-winter wheat; WWf: winter wheat-fallow; WWc: continuous winter wheat.
Block I
(8%)
Block II
(15%)
Block III
(27%)
Rep I
Rep II
Rep I
Rep II
Rep I
Rep II
B-WW
P-WW
WWf
WWc
P-WW
L-WW
WWf
WWc
B-WW
P-WW
B-WW
WWc
WWc
B-WW
L-WW
WWf
WWc
P-WW
L-WW
WWf
WWc
L-WW
WWf
B-WW
P-WW
L-WW
P-WW
B-WW
L-WW
WWf
Rep III
Rep IV
Rep III
Rep IV
Rep III
Rep IV
WWf
B-WW
P-WW
L-WW
WWc
L-WW
L-WW
P-WW
B-WW
WWc
L-WW
WWf
P-WW
WWf
L-WW
B-WW
WWf
WWc
WWc
WWc
WWc
WWf
P-WW
B-WW
B-WW
L-WW
WWf
L-WW
B-WW
P-WW
Block IV
(33%)
Block V
(40%)
Rep I
Rep II
Rep I
Rep II
P-WW
WWf
L-WW
WWc
L-WW
B-WW
WWc
P-WW
WWc
P-WW
B-WW
L-WW
B-WW
L-WW
WWf
WWf
WWf
WWc
P-WW
B-WW
Rep III
Rep IV
Rep III
Rep IV
B-WW
WWc
WWf
L-WW
WWc
WWf
B-WW
P-WW
L-WW
B-WW
L-WW
WWc
P-WW
L-WW
P-WW
WWf
WWf
P-WW
WWc
B-WW
-
Potential outcomes
-
This project will enable us to develop five predictive grain and protein yields models for cropping pea-winter wheat, lentil-winter wheat, and barley-winter wheat sequences in the drylands of Montana.
-
It will allow us to quantify relative contribution of soil moisture, soil temperature, and evapotranspiration to grain and protein yields of pea-winter wheat, lentil-winter wheat, and barley-winter wheat crop sequences in the drylands of Montana.
-
This study will provide a better and more accurate understanding of soil water dynamics in semi-arid agricultural systems.
-
The development of a decision-support tool to assist Montana farmers in the management of fallow lands.
Figure 1. Hydraulic soil sampling for the determination of the gravimetric soil moisture content in September 2015 at the WTARC
Figure 2. Experiment layout in the fall 2015 showing emerged winter wheat plots interspersed between future pulse and barley plots at the WTARC.
STUDY 4: Evaluation of four seed coating compounds for the establishment of winter wheat in saline soils.
Principal Investigators: Dr Roger Ondoua, Assistant Professor, Agronomy and Nutrient Management, MAES/Western Triangle Agricultural Research Center (WTARC).
Collaborator: Phillip Hammermeister, Research Assistant, Western Triangle Agricultural Research Center;
Institution Cooperator: Montana Salinity Control Association
Farmer Cooperator: Barry Wharram, Highwood, MT.
-
-
Objective: to test prototype seed coating compounds designed to enhance the establishment of winter wheat in saline soils.
-
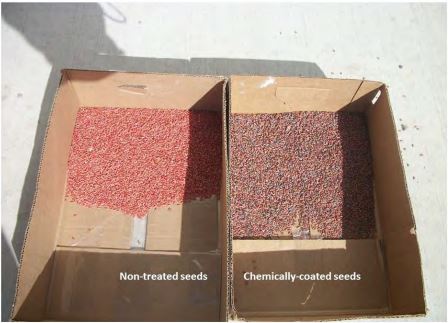
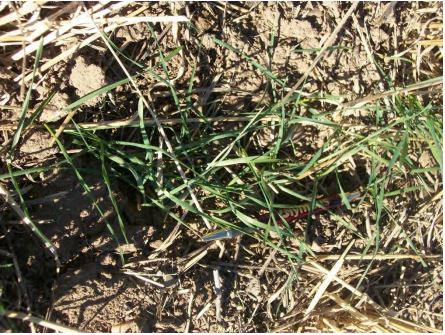
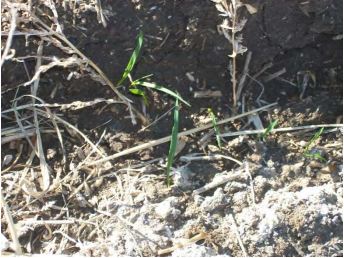
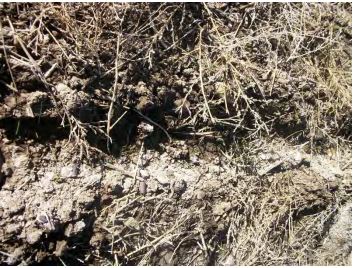
Methods: four seed coating compounds from P.I. Bioscience Limited were applied to seed of Yellowstone winter wheat variety at the rate of 5 litres/ton seed (Figure 3) at the WTARC’s seed laboratory. The trial was located around the Wharram saline seep in September 2015, in Highwood, Chouteau County of Montana (Figure 4). The experimental design was a split-split- plot in a randomized complete block design with four repetitions. The main factor was soil electrical conductivity (EC) with two levels (High and Low EC); the sub-plot factor was seeding rate with two levels (normal and late seeding dates); and the sub-sub-plot factor was seed coating compound with four levels (A, B, C, D). Four high EC blocks, with EC values ranging from 3-7 mmhos/cm, were set up around the eye of the saline seep; while four low EC blocks, with an average EC value of 0.3 mmhos/cm, were set up further inland (Figures 5, 6, 7).
-
-
3. Data to be collected: the following variables will be measured and assessed: seedling emergence, tiller number, phytotoxicity, grain yield and quality.
Figure 3. Chemically-coated and non-coated Yellowstone seeds
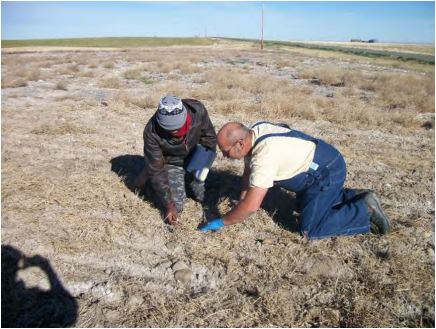
Figure. 4. Dr Roger Ondoua and Philip Hammermeister checking out seed germination around the Wharram seep (background) in Highwood, Chouteau County, Montana.
Figure 5: emergence of winter wheat seeds at 0.3 mmhos/cm
Figure 6: emergence of winter wheat seeds at 4 mmhos/cm
Figure 7: emergence of winter wheat seeds at 8.0 mmhos/cm

