Evaluation of trap crops for the management of wireworms (Coleoptera: Elateridae) on spring wheat
Principal Investigator: Dr. Gadi V. P. Reddy.
Cooperators: Ashish Adhikari, Dr. Frank Antwi, John H. Miller.
Western Triangle Agricultural Research Center,
Montana State University,
9546 Old Shelby Rd,
Conrad, MT 59425
Introduction
Different cereals, oilseed and legumes were evaluated as trap crop intercropped with wheat for the management of wireworms (Coleopteran: Elateridae) on spring wheat at two locations Valier and Conrad, MT from May to Mid-August, 2015. Four cereals: corn, wheat, durum and barley, two legumes: pea and lentil and one oilseed canola were the seven treatment that were intercropped with main crop wheat to reduce the damage and management of wireworms. Plant count of wheat and trap crops were taken using line intercept of 1m and wireworm number for each treatment were determined by destructive soil samples. No significance difference was observed in total number of plant count whereas there were significant difference in number of healthy plant or no damage plant count due to wireworm in treatment pea and lentil in both sites. Also, the number of wireworms differ significantly for wheat intercropped with pea and lentil in Valier but only for wheat intercropped with Pea in Conrad.
Materials and Methods
Location and experimental design
The trails were conducted on two locations: Valier and Conrad, Montana from May to August, 2015 in Golden Triangle Region of Montana. These fields have history and well known for having infested with wireworms. Valier location has sandy loan soil texture but soil of Conrad has silt clay, rich in humus. Spring wheat is the main crop grown in these locations from the past few years.
The study area is a plot of 40 m×12.6m, that was measured and divided into 42 experimental units each measuring 1.2m×4.8m. The complete randomized block design with six replications was conducted. There blocks were separated by 1m border and two plots were separated by 0.45m within a replication. Each plot has four rows having 0.3m gap between two rows; the first and third rows are always the main crop wheat and trap crops were used as intercrop in second and last row. The study has seven treatments that is seven trap crops those were intercropped in wheat. The species of trap crops used were Montech 4193 pea (T1), HyClass 955 canola (T2), Kandy Korn sweet corn (T3), Mountrail durum (T4), Metcalfe barley (T5), Greenland lentil (T6) and Duclair wheat as control (T0), respectively.
Field Preparation and Sowing
Minimum tillage was done for making the field ready for sowing. Seed driller was used for sowing. The rate of sowing was 22 seeds/m, 26 seeds/m, 26seeds/m 24 seeds /m, 7 seeds/m and 53 seeds/m for wheat, lentil, barley, durum, corn and pea respectively. In Valier, the sowing was done on May 4, 2015 while in Conrad the sowing was done on May 8, 2015. At the time of sowing, herbicide AMS having active ingredient Ammonium sulphate at the rate 2.24 kg /ha and fertilizers N, P and K ratio at 224.2,0, 22.4 kg /ha was broadcasted respectively. The sowing date was done on May 4, 2015 in Valier and May 8, 2015 in Conrad.
Data collection
The Effectiveness of Trap crop
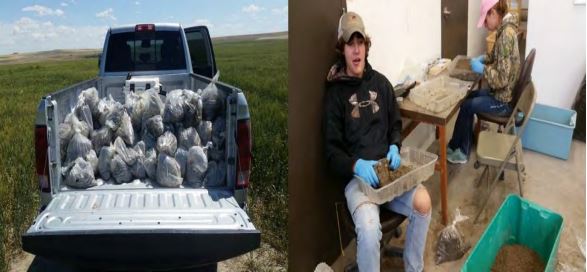
This will be done based on number of healthy seedling/ plant count of main crop wheat for each treatment and number of wireworms found in soil sample from wheat and the following trap crops in the plots (Fig-1).
Figure-1: Soil sample processing for wireworms
Plant/Seedling count
The number of plants/seedling in each plot was measured by counting plants stand from randomly selected line intercept of 1m. In an individual plot, from the two rows of wheat three spots were selected at random and the counting was done. Similar method was followed to trap crops intercropped with wheat. While taking the count we categorize the wheat quantitatively into damaged and healthy. Healthy one was those that had no any damage in the best plant within the sampling meter. We do graded the damage as 20, 40, 60, 80 and 100% based on the wilting or yellowish appearance and plant height. Due to the cold climate there was delay in germination. The first data was taken on May 22, 2015 in Valier and on May 26 in Conrad. The following recording was done at the interval of a week in both sites. After fifth reading on both sites we increased the time period between two readings to two weeks that is 14 days. All together we took eight plant count in both sites.
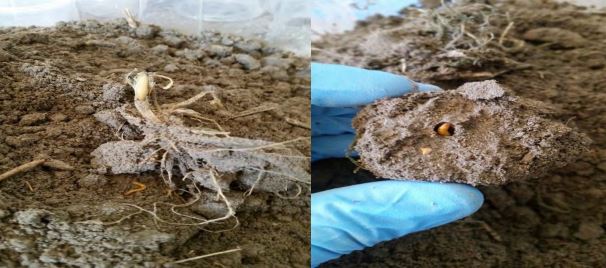
Figure-2: Soil sample processing and recovery of wireworms
Wireworm sampling.
Destructive soil sampling method was applied to sample the wireworms. An instrument will be build up having dimension of 0.15*0.15*0.15m3 that was used to take the soil sample. The samples were taken at random from each row in a plots. In row, the sampler was placed in such a way that the row was in middle and using the metal hammer, the sample was be taken. These samples was then put in plastic bag label it and brought to the Research Centre where they were processed and number of wireworms were counted and recorded. These wireworms were then kept in small plastic pots and put in the refrigerator at 8 degree Celsius. The soil sample was collected the day after the plant count was taken (Fig- 2). Total eight soil samples were collected from both sites.
Statistical Analysis
Analysis of variance (ANOVA) was used to analyze difference among treatment for total wheat plant counts and no damage or healthy plant counts. Pair difference or contrast were made for means of plant count at 95% confidence interval. Values of P < 0.05 were considered significant. T-test at 95% confidence interval was used to analyze the different for number of wireworms trapped among treatments.
Results
Plant count
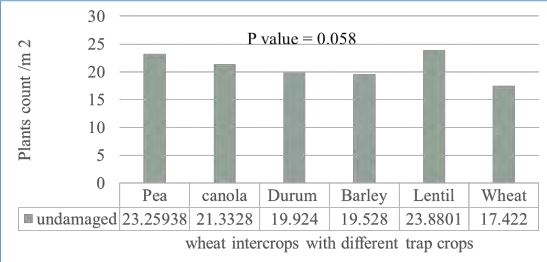
In Valier location, there were no significant difference among total plant counts of wheat between treatments and the control (F6,49= 1.13, P> 0.05). However, the number of healthy wheat plant counts for treatments showed almost significant difference (F6,49 = 2.20, P= 0.058; Fig-3). The pairwise difference or contrast of treatment for total wheat plant at 95% confidence interval, we found that there were no significant difference between any one treatments with control. On the other hand, the contrasts for healthy wheat plant of treatments and control, there were significant difference among treatment pea with control and treatment lentil with control both have P value less than 0.05. The other pairs: canola vs control, corn vs control, durum vs control, barley vs control do not showed significant difference.
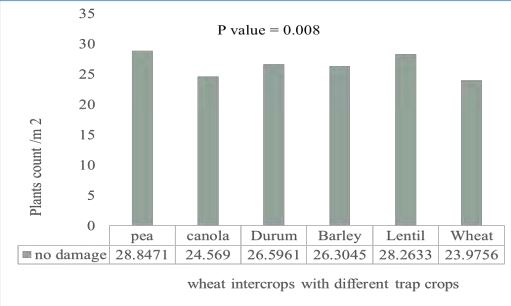
In Conrad location, there were no significant difference among total plant counts of wheat between treatments and the control (F6,49= 0.923, P> 0.05; Fig-4). However, the number of healthy wheat plant counts for treatments showed almost significant difference (F6,49 = 3.300, P= 0.008). The pairwise difference or contrast of treatment for total wheat plant at 95% confidence interval, we found that there were no significant difference between any one treatments with control. On the other hand, the contrasts for healthy wheat plant of treatments and control, there were significant difference among treatment pea with control and treatment lentil with control both have P value less than 0.05. The other pairs: canola vs control, corn vs control, durum vs control, barley vs control do not showed significant difference.
Acknowledgements
This work was supported by Montana Wheat and Barley Committee. We would like to thank Javan Carol, Gaby Drisinski for assistance with field work.
Figure-3: Number of healthy plants recorded/ m2 in Valier.
Figure-4: Number of healthy plants recorded/ m2 in Conrad.
Wireworms:
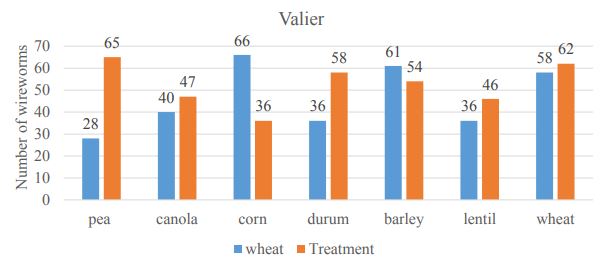
For Valier location, the total number of wireworms found was 683. The number of wireworms found in each treatment was shown in Fig-5. The pair difference between the numbers of wireworms found in wheat row of treatment with wheat row of control showed there were significant difference among wheat pea (Wp) 0.039.
Figure-5: Number of wireworms recorded per 2.5 kg soil destructive soil sample in Valier.
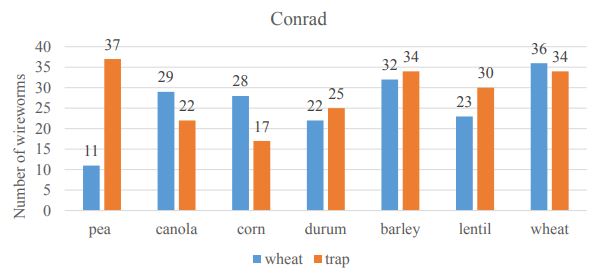
For Conrad location, the total number of wireworms found was 391. The pair difference between the numbers of wireworms found in wheat row of treatment with wheat row of control showed there were significant difference among wheat pea (Wp) with control having p value 0.013 respectively (Fig-5).
Figure-6: Number of wireworms recorded per 2.5 kg soil destructive soil sample in Conrad.

