Evaluation of the effectiveness of entomopathogenic fungus and trap crops for the management of wireworms on spring wheat
Principal Investigator: Dr. Gadi V.P. Reddy1
Project collaborators: Stefan T. Jaronski2, Kevin Wanner3 and Heikki M. Hokkanen4, Dr. David I Shapiro Ilan5, Dr. Adams Byron6, Dr. Vincent H. Smith7
Project personnel: Anamika Sharma1, Ramandeep Kaur Sandhi1 and John H. Miller1
1Western Triangle Agricultural Research Center, Montana State University, Conrad, MT 2United States Department of Agriculture, Agricultural Research Service, Northern Plains Agricultural Research Laboratory, 1500 N. Central Avenue, Sidney, MT
3Department of Plant Science and Plant Pathology, Montana State University, Bozeman, 4Department of Agricultural Sciences, University of Helsinki, FI-00014 Helsinki, Finland 5 Fruit and Tree Nut Research, USDA-ARS, Georgia.
6 Brigham Young University, Provo, Utah.
7 Department of Agricultural Economics and Director of the Agricultural Marketing Policy Center at Montana State University.
Aim of the study
The aims of this study were: 1) to evaluate the effectiveness of trap crops for the management of wireworms and 2) to evaluate efficacy of entomopathogenic fungi for wireworm management under lab and field conditions.
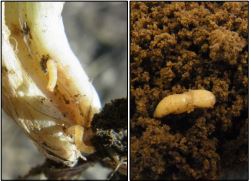
Figure 1: Wireworms feeding on spring wheat and pupa of wireworm in the
Material and Methods Study sites
In 2018, six sites were selected for evaluating entomopathogenic fungus and trap crops. All the sites were pre analyzed for presence of wireworms before commencing the experiments. Three irrigated and two non-irrigated sites were selected in Pondera and Teton counties. Three irrigated sites were at Ledger (N48o 16.334’ W111o 53.175’), Valier (N48o 18.454’ W111o 55.524’), and Choteau (N47o 90.238’ W112o 23.802’) and two non-irrigated sites were at Pendroy (N48o 56.009’ W111o 40.565’; hereafter named as Pendroy-1) and (N48o 04.206’ W112o 20.099’; hereafter named as Pendroy-2). The wireworm pressure was moderate to high in the selected sites.
Experimental design
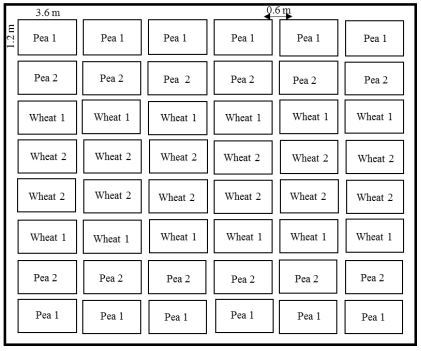
The experiment used a Randomized Complete Block Design (for EPF experiment) and Split Plot Design (for trap crop experiment) with a total of 48 plots [including four replications. Each plot was 3.6 ×1.2 m. Buffer zones of 0.6 m were maintained between plots. Before seeding, the herbicide glyphosate (RT3®, Monsanto Company, St. Louis, MO) was applied at 2.5 L/ha for weed control, following regional farming practices. Before planting, fertilizer (N, P, and K) was applied at a ratio of 224.2, 0, and 22.4 kg/ha in a band about an inch away from the seed using Morris® double shoot no-till openers during planting, and an additional fertilizer application (N, P, and K at a ratio of 12.3, 25.2, and 0 kg/ha) was applied with the seed through the seeding cone of the plot drill. The experimental plots at irrigated sites received 5 cm of water via overhead irrigation once a week. Non-irrigated sites did not receive any water. For trap crop experiment, Duclair spring wheat were seeded at 22 seeds/sq.ft and Montech pea at 12 seeds/sq.ft. Each plot had four rows. Peas and wheat at every site were seeded in 48 plots, outer 12 plots on each side were seeded with peas and inner 24 plots were seeded with wheat. In each plot four rows were planted. Peas in outer rows are named as Pea1 and inner rows are named as Pea 2. Inner most wheat rows are named as Wheat 2 and outer rows of wheat are named as Wheat 1 (Figure 2). For entomopathogenic fungus (EPF) experiment, spring wheat cultivar, Duclair was seeded at the rate of 22 seeds/sq. feet. Imidacloprid (Gaucho® 600, Bayer Crop Science), seed treatment commonly used by growers, was used as a chemical control. EPFs used in 2018 were on two carrier, millet and couscous. The treatments applied in field were in granules on millet and couscous. The treatments were, millet, couscous, Beauveria bassiana GHA millet, Beauveria bassiana GHA couscous, Beauveria bassiana ERL836 millet, Beauveria bassiana ERL836 couscous, Metarhizium brunneum F52 millet, Metarhizium brunneum F52 couscous, Metarhizium robertsii DWR2009 millet, and Metarhizium robertsii DWR2009 couscous. All EPF treatments were applied with seeds in furrows (at the rate of 5gms/plot Table 1). The fungus formulations were prepared by USDA ARS, Sidney MT. The fields were seeded at Pendroy (14 May and 16 May), Choteau and Valier (24 May) and Ledger (29 May 2018). The first irrigation took place within 30 days of planting in irrigated fields, and crops were harvested in August and October 2018.
Sampling for plant damage
To determine the level of crop damage from wireworms, the number of seedlings in each plot was measured randomly using the 1 m line intercept method. Two counts were taken from each plot, from the two middle rows. The first count was taken two weeks after planting. The starting and ending points of the sample areas (n = 2; each 1 m in length) were labeled with wooden stakes, so that the same group of seedlings could be recounted each time. Subsequent counts were taken at two-week intervals at both sites. At harvest, the height of these same marked plants was recorded using a wooden meter scale (Washington, USA).
Sampling for wireworms density
To determine the density of wireworms larvae, traps were established in each plot areas following the soil sampling bait-trap method of Reddy et al. (2014), which consisted of stockings filled with a mixture of wheat and barley.
Figure 2: The schematic representation of the split plot design of experiment at five sites in 2018. Spring wheat as a main crop, was planted inside and rows of pea were planted as border.
The traps were soaked for 24 hours to make the seeds sprout which is attractive to wireworms due to CO2 release. The traps were buried in 8–15 cm deep hole and were covered with black plastic to provide an amenable environment to wireworms. Traps were then collected at 15 days and 30 days post-deployment for assessment of larval numbers. Traps with wireworms were brought to the Western Triangle Agricultural Research Center (WTARC), Conrad, Montana. At WTARC, traps were processed in Berlese Funnels (Bioquip products, California, USA; wooden stands set up for Berlese Funnel were built at WTARC) and wireworms were separately collected from each plot and identified using keys described by Etzler (2013).
Post-harvest data collection
Before harvesting, the plot’s surface areas were calculated. After harvesting, wheat and pea from each plot were brought to the WTARC facility and cleaned using a seed cleaning machine (Almaco, Allan Machine Company, Iowa, USA). The plot and test weight was measured using a laboratory balance (Ohaus, Adventure™ Pro model AV8101). Wheat samples were processed through a grain analyzer (Perten Instruments IM9500; Hägersten, Sweden) to determine grain moisture and protein, while peas and lentils were processed with another grain analyzer (Perten Instruments AM5200; Hägersten, Sweden). Protein in pea was analyzed using a Foss grain analyzer (Infratec™ 1241).
Statistical analysis
Analysis of variance (ANOVA) was carried out using the PROC Mixed procedure in SAS 9.4 (PROC Mixed, SAS Institute 2018). Data were pooled for each replicate, and treatments were
considered as fixed effects while the block was considered a random effect. Normality of data was tested with a Univariate procedure (PROC Mixed). The effect of treatments, on the number of plants, seed test weight, seed yield, and the number of wireworms within wheat were analyzed in ANOVA. Estimates of least square means and differences of least square means were evaluated (Type 3 test of fixed effects F-test). Multiple comparisons among the treatments were made using Fisher’s Least Significant Test (LSD) at α = 0.05 by using the standard error generated in ANOVA. In trap crop experiment, dispersion of wireworms between the plots was evaluated by using Generalized Linear Model.
Results
Evaluation of efficacy of entomopathogenic fungus
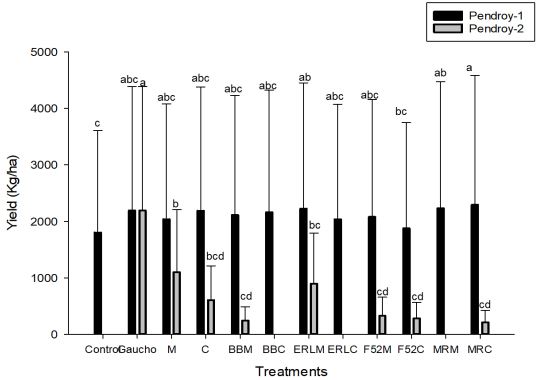
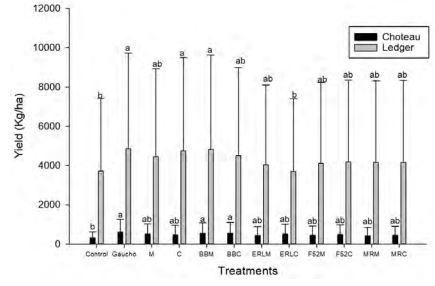
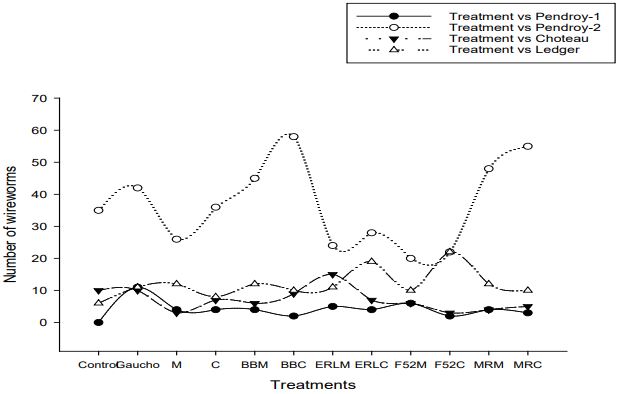
Out of five selected sites, significant variation in yield was only found at one site (Pendroy-2; F=772; df=33; P<0.0001) (Figure 3, 4). Wireworm pressure at all the five sites varied and Pendroy- 2 site had highest wireworm pressure (>5 per trap), followed by Ledger (<1.5 per trap), Choteau (<1 per trap), Pendroy-1 (0.5 per trap) and Valier site (<0.2 per trap) (Figure 5). Since at Valier site, the wireworm pressure was much lesser (Table 3), hence we do not consider the impact of treatments on yield at that site for both EPF and trap crop experiment. The yields were greater at irrigated sites but at Choteau site which is irrigated hail damage was incurred hence the yield was less (Table 2, 4; Figure 4). Nevertheless, among non-irrigated sites after post-hoc analysis (α=0.05), at Pendroy-1 site Beauveria bassiana ERL836 on millet carrier and Metarhizium robertsii DWR2009 on both millet and couscous carrier provided significantly greater yield compared to control (F=403; df=33; P<0.3947). At Pendroy-2 the greater wireworm pressure resulted in no yield with some treatments. Conventional seed treatment (imidacloprid) provided a significant yield and hence protection from wireworms. Treatments, B. bassiana ERL836 on millet carrier and millet carrier alone provided a significant protection against wireworm (Table 2; F=772; df=33; P<0.0001). These two treatments also had significantly greater test weight. At irrigated sites, at both sites, Beauveria bassiana GHA on millet and couscous carrier and couscous alone as carrier provided a significant yield compared to control (Table 2; F=205; df=33; P<0.33; F=933; df=33; P<0.19).
Evaluation of the effectiveness of trap crops
All the sites have the variances which are higher than the observed means indicated that dispersion of wireworms was high between the wheat and pea plots (Table 3). This dispersion also made the analysis complicated since Yield of wheat in both treatments (Wheat 1 and Wheat 2) did not differ significantly at any site but yield of peas differed significantly in both treatments (Pea 1 and Pea 2) at sites, Pendroy 2 and Choteau (Table 4; F=13; df=11; P<0.003). At site Pendroy 2 which has maximum average wireworm pressure pea yield was significantly less in inner rows compared to outer rows of peas (F=8.3; df=11; P<.0001) indicating greater damage to peas closer to wheat rows. At all the five sites there was no difference in the wheat yield in wheat 1 and wheat 2 rows indicating no effect of pea rows on wheat yield (Table 4). The wireworm population dispersion in 15 to 30 days’ time, at Pendroy 2 site, indicated increase in wireworm number with the time but greater increase was observed in wheat rows. Only at Pendroy 1 site, reduction in wireworm population was observed in 30 days’ time and otherwise rest all the sites had greater population of wireworms in 30 days’ time. Overall, the impact of pea crop was not observed in wheat crops.
Conclusion
In 2017, Metarhizium robertsii DWR2009 on millet gave numerically high yield. This year we tested the efficacy of carrier (millet and couscous) and also new strain, Beauveria bassiana ERL836. In 2018, results indicated that in non-irrigated sites millet and Beauveria bassiana ERL836 on millet gave protection from wireworms and hence greater yield was observed in the plots treated with these two treatments. Whereas in irrigated sites, Beauveria bassiana GHA on millet and couscous carrier and couscous alone as carrier gave higher yield. The results indicate that both millet and couscous have impact on wireworms along with entomopathogenic fungus. In trap crop experiment, according to last results (Adhikari and Reddy 2017; Sharma et al. 2018), pulses especially peas attracted wireworms towards them and hence this year we have tested peas along with border in split plot design. This year, we have found that at the site where wireworm pressure was highest, pea rows closer to wheat had more damage and hence less yield was noticed. Nevertheless, due to high wireworm dispersion, no significant effect was noticed in wheat yield and further exploration is required.
Table 1 Materials, rates, and methods of application for treatments applied in study of wireworm control at non-irrigated (Pendroy-1 and Pendroy-2) and irrigated sites (Choteau and Ledger), Montana in 2018.
|
Treatment |
Material |
Rate |
Source |
|
T1: |
Control (Water) |
|
|
|
T2: |
Gaucho® (Imidacloprid) |
0.157 ml/L (2.4 oz/45.352 kg/seed) |
Bayer Crop Science |
|
T3: |
Millet |
(10lb/acre) 5 gms/plot |
Stefan T. Jaronski USDA ARS |
|
T4: |
Couscous |
(10lb/acre) 5 gms/plot |
Stefan T. Jaronski USDA ARS |
|
T5: |
Beauveria bassiana GHA Millet |
(10lb/acre) 5 gms/plot |
Stefan T. Jaronski USDA ARS |
|
T6: |
Beauveria bassiana GHA Couscous |
(10lb/acre) 5 gms/plot |
Stefan T. Jaronski USDA ARS |
|
T7: |
Beauveria bassiana ERL836 Millet |
(10lb/acre) 5 gms/plot |
Stefan T. Jaronski USDA ARS |
|
T8: |
Beauveria bassiana ERL836 Couscous |
(10lb/acre) 5 gms/plot |
Stefan T. Jaronski USDA ARS |
|
T9: |
Metarhizium brunneum F52 Millet |
(10lb/acre) 5 gms/plot |
Stefan T. Jaronski USDA ARS |
|
T10: |
Metarhizium brunneum F52 Couscous |
(10lb/acre) 5 gms/plot |
Stefan T. Jaronski USDA ARS |
|
T11: |
Metarhizium robertsii DWR2009 Millet |
(10lb/acre) 5 gms/plot |
Stefan T. Jaronski USDA ARS |
|
T12: |
Metarhizium robertsii DWR2009 Couscous |
(10lb/acre) 5 gms/plot |
Stefan T. Jaronski USDA ARS |
Table 2 Impact of Entomopathogenic fungus treatments on spring wheat ‘Duclair’ performance in 2018 in terms of plant count, yield, and test weight. Wireworm population collected from each treated plot is also analyzed. Standard error and least significant differences are calculated with the means generated by PROC MIXED analysis (α=0.05). The treatments were applied in Randomized Block Design (n=4); water was used as control (T1) and imidacloprid was used as chemical control (T2).
|
Non- irrigated sites |
|
|
|
|
Irrigated sites |
|
|
|
|
Pendroy site 1 |
|
|
|
|
Choteau |
|
|
|
|
Treatmen ts |
Plant Count |
Yield (kg/ha) |
Test Weight (gms) |
No. of wireworms |
Plant Count |
Yield (kg/ha) |
Test Weight (gms) |
No. of wireworms |
|
T1: |
8.37±0.7a |
1805±142c |
74.5±0.35a |
0±0.58a |
7.5±0.7a |
311±73b |
72±0.8ab |
2.5±0.76ab |
|
T2: |
9±0.7a |
2194±142abc |
73.4±0.35b |
2.75±0.58a |
7.7±0.7a |
629±73a |
74±0.8a |
2.5±0.76ab |
|
T3: |
8.37±0.7a |
2041±142abc |
74.2±0.35ab |
1±0.58a |
8.5±0.7a |
515±73ab |
73±0.8ab |
0.75±0.76b |
|
T4: |
9±0.7a |
2190±142abc |
74.4±0.35a |
1±0.58a |
8.5±0.7a |
476±73ab |
72±0.8ab |
1.75±0.76b |
|
T5: |
9.37±0.7a |
2114±142abc |
74.25±0.35ab |
1±0.58a |
8±0.7a |
541±73a |
73±0.8ab |
1.5±0.76b |
|
T6: |
9.25±0.7a |
2162±142abc |
74.26±0.35ab |
0.5±0.58a |
8.2±0.7a |
553±73a |
72±0.8ab |
2.3±0.76ab |
|
T7: |
8.87±0.7a |
2226±142ab |
74.91±0.35a |
1.25±0.58a |
9.2±0.7a |
440±73ab |
73±0.8ab |
3.75±0.76a |
|
T8: |
8.75±0.7a |
2038±142abc |
74.51±0.35a |
1±0.58a |
7.6±0.7a |
507±73ab |
72±0.8ab |
1.75±0.76b |
|
T9: |
8.87±0.7a |
2081±142abc |
74.37±0.35a |
1.5±0.58a |
8.7±0.7a |
465±73ab |
71±0.8b |
1.5±0.76b |
|
T10: |
8.87±0.7a |
1877±142bc |
74.52±0.35a |
0.5±0.58a |
8.5±0.7a |
492±73ab |
73±0.8ab |
0.75±0.76b |
|
T11: |
8±0.7a |
2236±142ab |
74.46±0.35a |
1±0.58a |
8.8±0.7a |
430±73ab |
73±0.8ab |
1±0.76b |
|
T12: |
9.12±0.7a |
2293±142a |
74.42±0.35a |
0.75±0.58a |
8.8±0.7a |
455±73ab |
74±0.8a |
1.2±0.76b |
|
F (P) |
1.9 (0.97) |
403.53 (0.3947) |
0.88 (0.29) |
1.6 (0.23) |
1.78 (0.66) |
205 (0.33) |
2.3 (0.53) |
2 (0.19) |
|
Pendroy site 2 |
|
|
|
|
|
|
|
|
|
Treatmen ts |
Plant Count |
Yield (kg/ha) |
Test Weight (gms) |
No. of wireworms |
Plant Count |
Yield (kg/ha) |
Test Weight (gms) |
No. of wireworms |
|
T1: |
2±0.88b |
0±277d |
0±13d |
9±3abc |
13.5±1.4b |
3710±348b |
74±0.5bc |
1.5±1.5a |
|
T2: |
9±0.88a |
2194±277a |
72±13a |
10±3abc |
16.8±1.4ab |
4857±348a |
75±0.5a |
2.75±1.5a |
|
T3: |
2±0.88b |
1103±277b |
52±13ab |
7±3abc |
14.8±1.4ab |
4457±348ab |
74±0.5abc |
3±1.5a |
|
T4: |
2±0.88b |
606±277bcd |
35±13bcd |
9±3abc |
13±1.4b |
4742±348a |
74.6±0.5abc |
2±1.5a |
|
T5: |
2±0.88b |
244±277cd |
16±13cd |
11±3abc |
14.9±1.4ab |
4819±348a |
74.8±0.5ab |
3±1.5a |
|
T6: |
1±0.88b |
0±277d |
0±13d |
15±3a |
15±1.4ab |
4497±348ab |
74.4±0.5abc |
2.5±1.5a |
|
T7: |
3±0.88b |
898±277bc |
50±13abc |
6±3bc |
13.2±1.4b |
4048±348ab |
74±0.5abc |
2.75±1.5a |
|
T8: |
1±0.88b |
0±277d |
0±13d |
7±3abc |
15.3±1.4ab |
3707±348b |
73.6±0.5c |
4.75±1.5a |
|
T9: |
2±0.88b |
330±277cd |
16±13cd |
5±3c |
15.6±1.4ab |
4112±348ab |
74±0.5abc |
2.5±1.5a |
|
T10: |
2±0.88b |
284±277cd |
17±13d |
6±3bc |
17.8±1.4a |
4175±348ab |
74±0.5abc |
5.5±1.5a |
|
T11: |
1±0.88b |
0±277d |
0±13d |
12±3abc |
15.2±1.4ab |
4157±348ab |
74±0.5abc |
3±1.5a |
|
T12: |
1±0.88b |
213±277cd |
16±13cd |
14±3ab |
13.6±1.4b |
4163±348ab |
73.9±0.5bc |
2.5±1.5a |
|
F (P) |
2.5 (<.0001) |
772 (<.0001) |
36 (0.0018) |
8.4 (0.3) |
4 (0.43) |
933 (0.19) |
1 (0.29) |
4.2 (0.85) |
Figure 3. Mean yield (kg/ha) of wheat at two non-irrigated sites, Pendroy-1 ( ) and Pendroy-2 ( ) in 2018. [n = 4]. Different letters above the bars indicate significant differences (α= 0.05). y- axis shows mean yield (mean yield+ SE) and x-axis indicates twelve treatments.
Figure 4. Mean yield (kg/ha) of wheat at two non-irrigated sites, Choteau and Ledger in 2018. [n = 4]. Different letters above the bars indicate significant differences (a=0.05). y-axis shows mean yield (mean yield+S) and x-axis indicates twelve treatments.
Figure 5. Total numbers of wireworms collected in bait traps associated with the wheat at different treatments at Pendroy-1 ( ), Pendroy-2 ( ), Choteau ( ), and Ledger ( ) in 2018. [n = 4]. Difference were analyzed between treatments at α= 0.05. y-axis shows number of wireworms (mean+ SE) and x-axis indicates twelve treatments.
Table 3: The average counts are small (less than 3), except for site JS, which shows much higher average counts, especially for wheat. Some of the variances are (much) higher than the observed means, indicating that over dispersion of wireworms is found throughout all the sites. The variances are calculated by using Generalized Linear Model (GLM).
|
Site |
Day |
Crop |
Mean |
Variances |
|
Pendroy 1 |
15 |
pea |
0.9 |
2.2 |
|
Pendroy 1 |
15 |
wheat |
0.6 |
0.9 |
|
Pendroy 1 |
30 |
pea |
0.3 |
0.4 |
|
Pendroy 1 |
30 |
wheat |
0.3 |
0.6 |
|
Pendroy 2 |
15 |
pea |
3.0 |
5.9 |
|
Pendroy 2 |
15 |
wheat |
6.4 |
49.2 |
|
Pendroy 2 |
30 |
pea |
4.7 |
30.2 |
|
Pendroy 2 |
30 |
wheat |
15.3 |
318.4 |
|
Choteau |
15 |
pea |
0.5 |
0.5 |
|
Choteau |
15 |
wheat |
1.1 |
1.2 |
|
Choteau |
30 |
pea |
1.2 |
2.3 |
|
Choteau |
30 |
wheat |
1.3 |
4.0 |
|
Ledger |
15 |
pea |
2.0 |
8.4 |
|
Ledger |
15 |
wheat |
1.1 |
1.6 |
|
Ledger |
30 |
pea |
2.9 |
9.4 |
|
Ledger |
30 |
wheat |
1.5 |
3.9 |
|
Valier |
15 |
wheat |
0.1 |
0.1 |
|
Valier |
15 |
wheat |
0.1 |
0.1 |
|
Valier |
30 |
pea |
0.0 |
0.0 |
|
Valier |
30 |
pea |
0.0 |
0.0 |
Table 4: Yield of spring wheat ‘Duclair’ and ‘Montech’ pea in 2018. Standard error and least significant differences are calculated with the means generated by PROC MIXED analysis (α=0.05). The treatments were applied in Split Plot Design.
|
|
Pendroy 1 |
Pendroy 2 |
Choteau |
Ledger |
|
Pea 1 |
2118±88a |
163±5a |
228±32b |
2996±177a |
|
Pea 2 |
2058±88a |
130±5b |
259±32a |
3120±177a |
|
F (P) |
226 (0.5) |
8.3 (<.0001) |
13 (0.003) |
324 (0.4) |
|
Wheat 1 |
2100±82a |
256±250a |
1295±125a |
4093±237a |
|
Wheat 2 |
2144±82a |
387±250a |
1212±125a |
4027±237a |
|
F (P) |
154 (0.5) |
486 (0.5652) |
308 (0.5) |
420 (0.7) |
Acknowledgements
This work was supported by Montana Wheat and Barley Committee. We would like to thank summer interns Mikayla Connelly and Carley Ries for assistance with field work. We would also like to thank the producers, Mark Grubb, John Majerus, Jonathan Stoltz, Kevin Johnson, and Mike Leys for providing us the field to establish the experiments.
References
Adhikari A, and Reddy GVP. 2017. Evaluation of trap crops for the management of wireworms in spring wheat in Montana. Arthropod Plant Interact. 11: 755–766. DOI 10.1007/s11829-017- 9533-5.
Etzler FE. 2013. Identification of economic wireworms using traditional and molecular methods.
M.S. thesis dissertation, Montana State University, Bozeman, Montana.
Reddy, GVP, Tangtrakulwanich K, Wu, Miller JH, Ophus VL, Prewett J, and Jaronski ST. 2014. Evaluation of the effectiveness of the entomopathogens for the management of wireworms (Coleoptera: Elateridae) on spring wheat. J. Invertebr. Pathol. 120: 43–49.
SAS Institute Inc. 2018. 9.4 In-Database Products, User’s Guide, fifth ed. SAS Publishers, Cary, NC, USA.
Sharma A, Sandhi RK, Briar SS, Miller JH, and Reddy GVP. 2018. Assessing the performance of pea and lentil at different seeding densities as trap crops for the management of wireworms in spring wheat, Journal of Applied Entomology, accepted.

