Low Energy Sprinkler Application Effect on Montana Malt Barley
Principal investigator: Gadi V.P. Reddy, Professor of Entomology/Ecology
Personnel: John Miller, Research Scientist, Western Triangle Agricultural Research Center, Montana State University.
Background
Barley has been grown in North America over the years as a forage crop, feed crop and malt crop adapting to dry land and irrigated ecosystems, and it works well in rotation with sugar beets serving as a valuable source of malt in Montana. In spite of vast variation in response of barley varieties to soil types, rainfall, nutrient content and other environmental factors, Montana is second in barley production, producing 22% of the U.S. barley, with an average yield of 60 bu/ac. (USDA, 2015).
Providing water requirements by choosing acceptable irrigation methods to have the proper moisture distribution, leads to maximized grain yield, malt quality and decreases weed growth and disease. Depending on the irrigation method, optimum yield that might be expected to happen when available soil moisture (ASM) is to retain above 50% of ASM. The center pivot system is a dominant irrigation method in Montana barley fields, and was designed to conserve water. The pivot should be correctly installed and managed to achieve high water conservation. It has been reported that a pivot system is the most common irrigation method in Montana, and applies water in a uniform distribution and efficient manner, but is not the best method to keep the soil moisture at proper levels during the barley reproductive period (Rogers et al., 2008).
Water limitation or inappropriate distribution leads to abundant morpho-physiological and biochemical changes in plants. There are not too many studies on plant physiology responses to using different irrigation methods in terms of seed quality, yield and water conservation. Therefore, the present study aim to investigate on:
-
Compare Low Energy Sprinkler Application (LESA) irrigation system with regular or traditional irrigation method in one barley field.
-
Study the effect of irrigation methods on dry matter pattern and leaf area during the season.
-
Compare the differences in yield components, plant height and physiological traits related to yield under different irrigation application methods.
Material and methods
In order to test LESA methods and compare their effect on malt barley in Montana, experiments were conducted in three different locations, Fairfield, Conrad and Valier, to evaluate some phenological events, agronomic traits and physiological responses under center pivot system with a single drop tube (Regular), 2-drop tubes sprinklers with and 3-drop tubes for LESA pressure reducers and spreader plates. The two and three drop tubes were installed at the outlet for the single drop tube, the multiple drop tubes were split off the single outlet to create two or three drop tubes. Two data loggers and eight soil moisture sensors were installed at Conrad and Valier locations and three data loggers and 12 soil moisture sensors were installed and the Fairfield location. The soil moisture sensors were installed at four depths including, 24 inch, 18 inch, 12 inch and 6 inch below the soil surface after planting and removed from the fields when the plots were harvested. Soil moisture probes and data loggers were installed as soon after seeding as practical, they were installed at the Conrad location on June 8th, 2018, Fairfield location on June 12th and the Valier location on June 11th. Soil moisture samples were taken at harvest time, to a depth of two feet. Samples were broken into six-inch increments for all depths. Water usage was measured throughout the cropping season to see if there is a difference in efficiency between the irrigation methods.
Seeds were planted on April 27th in Fairfield, April 30thin Valier and May 15thin Conrad, at the rate of 110 lb/ac. Nitrogen fertilizer was applied as Urea at 120 lb/ac while seeding. Plant sampling plots were along both sides of field transects in parallel with installed soil sensors. Plot size was measured at 5 ft x 20 ft. Row spacing was considered about 7.5 inches.
For measuring leaf area index, leaf area meter (LAI C2200) was used to record plants leaf area at intervals of seven days between tillering and physiological maturity stage, during the time period of 10 a.m. to 2 p.m.
Plant samples were cut at ground level, oven dried at 70˚C for 72 hours to reach constant weight.
Biomass dry weight was recorded.
In addition, grain yield, test weight, seed protein, plump and thin kernels were collected after harvest. Plant height was measured using a ruler. A Wintersteiger Classic plot combine was used to collect harvest data for each sampling block along the transect.
After harvesting, kernel plumpness was assessed by sieving over a 6/64” slotted screen. Grain protein content and test weight were obtained at Western Triangle Agricultural Research Center, Conrad using the Near-Infrared Inframatic 9500 SW- Whole Grain Analyzer (Perten).
Statistical Analysis
Data were analyzed using CoStat Ver 6.400, CoHort Software and graphed using CoPlot Ver 6.400.
Results
Due to plant material getting over the rain gauges, the precipitation and irrigation water amounts are unreliable. With that said, Fairfield regular received 10.8 inches, 2 drop (2D) LESA system received 8.4 inches and 3 drop (3D) collected 10.2 inches. At the Valier location there was the most trouble with plants interfering with water collection. Valier 2D had 2.2 inches and the 3D was 2.6 inches, with the Conrad location receiving 4.3 inches for the 2D treatment and 4.1 inches for the 3D irrigation system.
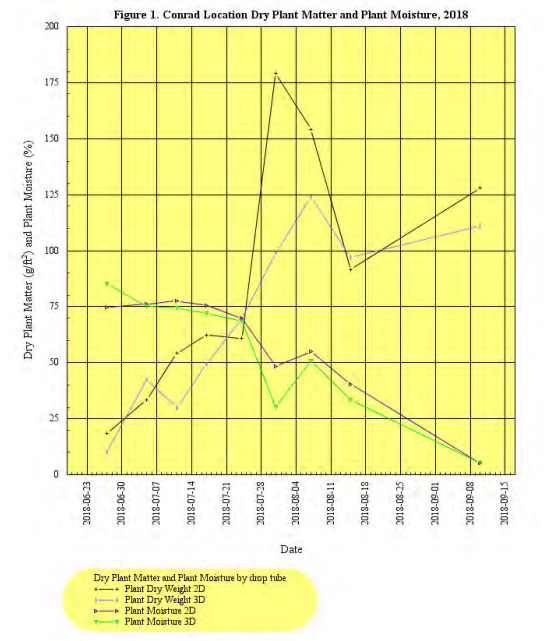
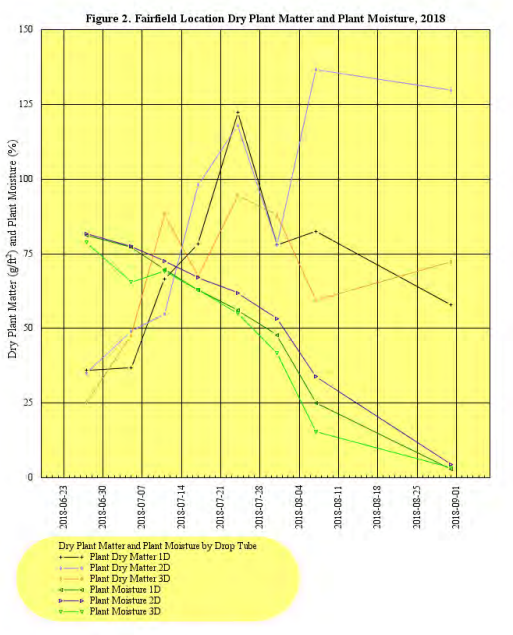
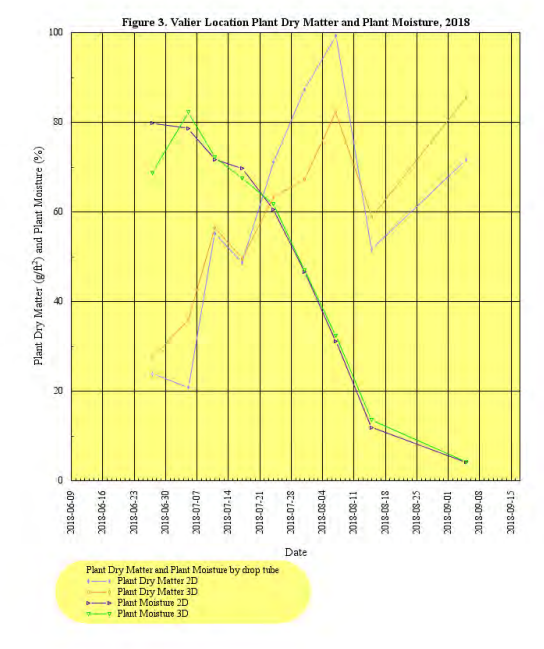
Plant dry matter accumulation increased by leaf number and tiller development until anthesis, and then started to decline as the plant began to ripen, with a noted increase just before harvest at each location (Figure 1 thru 3). The greatest accumulation of plant was under the 2D LESA system of irrigation with the least accumulation under the 3D system.
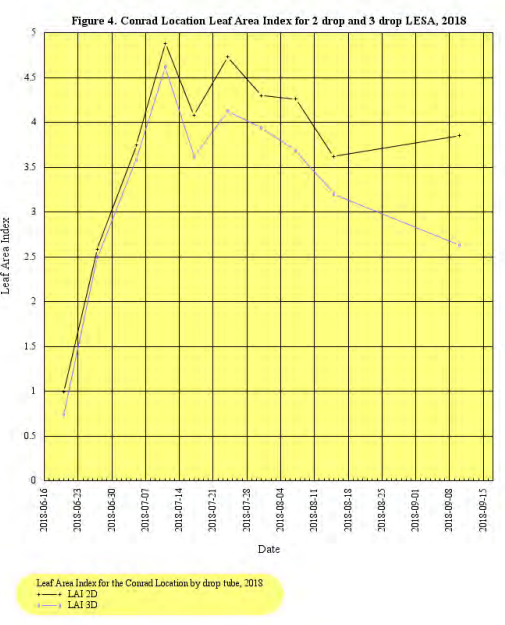
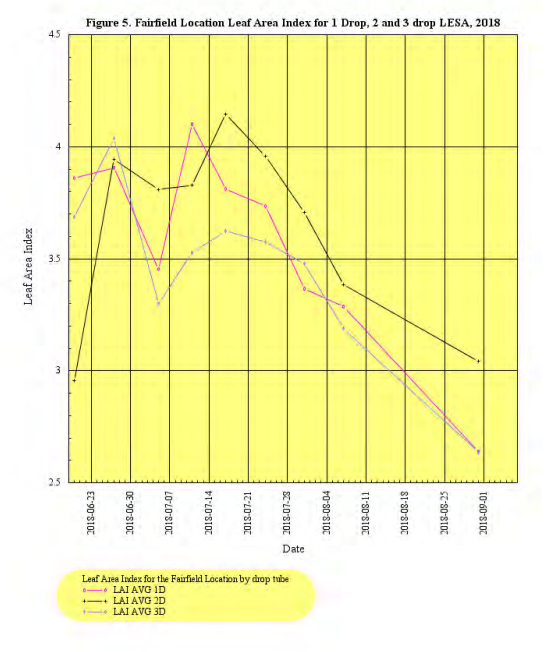
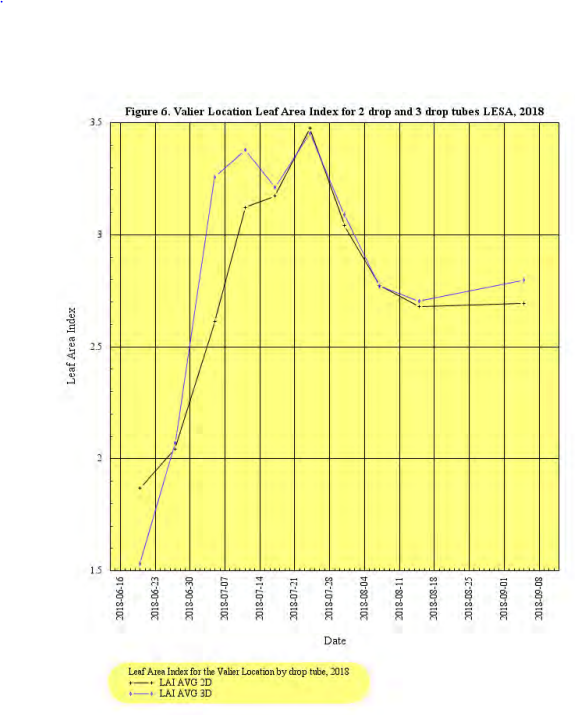
Maximum leaf area index (LAI) did not respond significantly to irrigation methods. But the slightly higher LAI across sites under the 2D LESA system. In general the greater the LAI is an indication of higher yields. Conrad and Fairfield locations had LAI’s greater than 4 and had better yields than the Valier location where the LAI did not 3.5 (Figures 5 thru 7).
Maximum of grain protein content was observed in Fairfield (13.7 % under 2-Drops sprinkler system). Results showed grain protein content under three-Drops sprinkler systems was higher compared to 2D LESA irrigation method in Conrad and Valier location while in Fairfield grain protein content respond to 2D LESA irrigation method more than other methods (Table 1).
In Fairfield location, maximum and minimum grain yield were gained from One drop (1D) sprinkler system, 2D LESA sprinkler methods with123.2 bu/ac, and 118.2 bu/ac, there was no significant difference between using Regular and LESA methods. In Valier location, maximum grain yield was observed in 2D sprinkler system (78.7 bu/ac) and at the Conrad location; 2D LESA center pivot system with 141.9 bu/ac had the maximum grain yield when compared to 3D LESA irrigation system (Table 1).
In general results show that irrigation methods of application did not have any significant effect on plant height, plumpness and thin.
Table 1 demonstrates that Conrad with 136 bu/ac had the maximum grain yield while minimum grain yield was obtained from Valier (93 bu/ac). Late planting dates may explain the variation in grain yield at the different sites. These variations are reflected by the effects of environmental parameters; such as temperature, rainfall pattern and soil characteristics on plant performance.
Table 1 shows the average of barley yield response to different irrigation application methods. However, 2D LESA sprinkler to have the better yields at the Conrad location with a yield of 141.9 bu/ac and 80.3 bu/ac at the Valier location, the exception was Fairfield with a yield of 118.2 bu/ac/. There was no significant yield difference between regular center pivot method and LESA application. Espinoza et al. (2004) well documented water pressure, nozzle height, and uniformity of sprinkler method, affect water productivity by indicating better distribution and water proportion. Without a proper uniform water release, and water use efficiency, grain yield will be significantly reduced.
Recommendation
Sprinkler height affects the wetted area, water distribution and water productivity especially in windy areas like Montana’s Western Golden Triangle region. Wind velocity also influenced water distribution and uniformity, once released from sprinkler irrigation systems. In the present study for most of parameters, there were no significant difference in using regular center pivot system and LESA application. Even though there are no significant differences in the grain data it appears that the 2D LESA irrigation system is equal to 1D and 3D irrigation methods. If a producer desires to make the change from regular pivot irrigation to the LESA irrigation system they should consider the 2D system over the 3D system. There are other factors to consider when changing the irrigation systems to LESA, such as lodging and keeping the barley heads dry to help with the prevention of disease.
Nozzle size, height and drop numbers to meet plants water requirements might increase regular pivot system efficiency. Testing different varieties of barley, various crops, using precision application based on crop needs and soil profile in consecutive multi location experiments would deliver scientists and farmers a better understanding of water- plant -soil relationships. In addition, assessing the effect of different water regimes on saved water amount and plant response would be useful.
Acknowledgment
We are grateful to In-Bev, Anheuser-BuschAg Company for financial and technical support during the experimental period. In addition, we appreciate Mr. Mike Hagar, Mr. Greg Orcutt and Mr. Ken Wheeler as experiment collaborators in Fairfield, Conrad and Valier. We are also grateful to Dr. Maral Etesami for her work during 2017 cropping season. A special thanks goes to Alysha Miller for her many efforts in this project.
References
Espinoza, B., J. C. E. P. Velez, J. C. Morales and B. R. Martinez. 2004. Impact of pressurized irrigation systems performance on productivity of eight crops, in Guanajuato, Mexico. Agrociencia-Montecillo 38(5): 477-486.
Rogers, D.H., M. Alam, and L.K. Shaw. 2008. Considerations for Sprinkler Packages on Center Pivots. Kansas State, Research and Extension. Irrigation Management Series. L-908 rev.
USDA. 2015. United State Department of Agriculture, Natural Agricultural Statistic Service, Montana Annual Crop Summary 2014.
Table 1. 2018 LESA irrigation, grain data by location.
|
Location |
Drop |
Yield |
Test Wt |
Height |
Plump |
Thin |
Protein |
|
|
Tubes2 |
(bu/ac1) |
(lb/bu1) |
(inch) |
(%) |
(%) |
(%) |
|
|
|
|
|
|
|
|
|
|
Conrad |
2 |
141.9 |
51.5 |
27.8 |
99.1 |
0.33 |
11.3 |
|
|
3 |
130.2 |
51.3 |
26.8 |
99.4 |
0.15 |
11.7 |
|
Mean |
|
136.0 |
51.4 |
27.3 |
99.3 |
0.23 |
11.4 |
|
LSD (.05) |
|
ns |
ns |
ns |
ns |
0.06 |
ns |
|
C.V. (s/mean)*100 |
|
8.5 |
0.77 |
4.6 |
0.15 |
22.7 |
6.5 |
|
P-Value |
|
0.2031 |
0.5271 |
0.3040 |
0.1008 |
0.0038 |
0.4467 |
|
|
|
|
|
|
|
|
|
|
Valier |
2 |
80.3 |
45.5 |
29.8 |
85.8 |
3.5 |
11.3 |
|
|
3 |
78.7 |
45.0 |
29.0 |
79.4 |
5.7 |
11.7 |
|
Mean |
|
79.5 |
45.3 |
29.4 |
82.6 |
4.6 |
11.4 |
|
LSD (.05) |
|
ns |
ns |
ns |
ns |
ns |
ns |
|
C.V. (s/mean)*100 |
|
16.4 |
3.1 |
3.6 |
10.7 |
62.9 |
6.5 |
|
P-Value |
|
0.8671 |
0.5858 |
0.3559 |
0.3517 |
0.3297 |
0.4467 |
|
|
|
|
|
|
|
|
|
|
Fairfield |
1 |
123.2 |
50.5 |
31.8 |
98.4 |
0.35 |
13.3 |
|
|
2 |
118.2 |
50.8 |
34.0 |
97.7 |
0.33 |
13.7 |
|
|
3 |
121.4 |
50.3 |
33.0 |
98.6 |
0.30 |
13.4 |
|
Mean |
|
120.9 |
50.5 |
32.9 |
98.2 |
0.33 |
13.5 |
|
LSD (.05) |
|
ns |
ns |
1.4 |
ns |
ns |
ns |
|
C.V. (s/mean)*100 |
|
11.0 |
0.88 |
2.6 |
1.0 |
38.0 |
3.0 |
|
P-Value |
|
0.8688 |
0.3118 |
0.016 |
0.4769 |
0.8515 |
0.3199 |
1 Yield and test weight are adjusted to 13% seed moisture.
2 One drop tube at Fairfield indicates normal irrigation.

