Monitoring of Wheat Midge and its Parasitoids Macroglenes penetrans and Platygaster tuberosula in Irrigated and Dryland Spring Wheat in Golden Triangle, Montana
Principal Investigator: Gadi V.P. Reddy
Project personnel: Govinda Shrestha and Ramadevi L. Gadi
Western Triangle Agricultural Research Center, Montana State University, 9546 Old Shelby Rd., P.O. Box 656, Conrad, MT 59425, USA
Aim of the study
The objectives of this study were: 1) to assess the wheat midge population trend in Golden Triangle, Montana, 2) the wheat midge population dynamics in irrigated and dryland spring wheat fields and 2) to monitor the wheat midge parasitoid M. penetrans and Platygaster tuberosula population, in irrigated and dryland spring wheat fields.
Materials and methods
Wheat midge populations
Western Triangle Agricultural Research team installed 15 delta traps baited with wheat midge pheromone lures (2S, 7S)-nonadiyl dibutyrate in spring wheat fields (dryland and irrigated) in multiple locations of Pondera, Toole, Teton and Chouteau Counties of Golden Triangle, Montana (Table 1). Pheromone traps were installed in 2nd week of June, 2018. Traps were checked at 1-3 days interval in Pondera (Ledger, Valier and WTARC trap sites) and Toole (Ledger), while at 15 days interval in Toole, Teton and Chouteau Counties locations. The monitoring work was wrapped up from last week of July to first week of August, 2018.
Parasitoids Macroglenes penetrans and Platygaster tuberosula population levels
The parasitoids adult population levels were monitored in traps installed in dryland and irrigated spring wheat fields located at Valier, WTARC and Ledger locations. Two methods such as sweep net and parasitoid pheromone traps were used to sample the adult parasitoids from each field. For sweep net sampling, 150 sweeps were made per field and the sampling was done at least 15 m from inside fields. The sweep net sampling was began in June 20 and completed in July 20, 2018. Parasitoid adults were monitored at 3-4 days interval throughout wheat midge adult activity period. Parasitoid pheromone lures baited on delta trap were installed in 3rd week of June, 2018. The total number traps were four and three for irrigated and dryland spring wheat fields, respectively. The traps were checked at 15 days interval. The collected samples were stored at -20 °C until processing. The parasitoids were identified under a microscope.
Results
Wheat midge population levels in the Golden Triangle, Montana
Total cumulative midge count observed in our trap established locations are shown in Table 1.
Table 1. Total cumulative wheat midge count per trap observed in Pondera, Toole, Teton and Chouteau Counties of Montana.
|
County |
Field name |
Lat. |
Lng. |
Total cumulative count/trap |
Parasitoid observed |
|
Pondera |
Kyle Dean House-irrigated |
48.3958 |
-112.2189 |
1179 |
Yes |
|
Pondera |
Kyle Dean Rock city-irrigated |
48.41 |
-112.196 |
800 |
Yes |
|
Pondera |
Kyle Dean-dryland |
48.3945 |
-112.1838 |
10 |
Yes |
|
Pondera |
Cory Crawford Crestview- irrigated |
48.3024 |
-112.1433 |
199 |
Yes |
|
Pondera |
Cory Crawford VHW-dryland |
48.3074 |
-112.1726 |
203 |
Yes |
|
Pondera |
Jodi Hobel BHR-irrigated |
48.2865 |
-112.0566 |
904 |
Yes |
|
Pondera |
Jodi Hobel BHR-dryland |
48.2905 |
-112.0565 |
25 |
Yes |
|
Pondera |
Jodi Hobel House-dryland |
48.2999 |
-112.12 |
57 |
Yes |
|
Pondera |
WTARC-irrigated |
48.3071 |
-111.9221 |
91 |
Yes |
|
Pondera |
WTARC-dryland |
48.305 |
-111.9244 |
30 |
Yes |
|
Pondera |
Terry Peters Pondera-dryland |
48.2567 |
-111.667 |
14 |
Yes |
|
Toole |
Terry Peters CS-dryland |
48.2524 |
-111.6012 |
10 |
Yes |
|
Toole |
Devon-dryland |
48.55311 |
-111.39644 |
3 |
No |
|
Teton |
Scott Inbody-dryland |
47.9112 |
-112.03736 |
5 |
No |
|
Chouteau |
Knees-dryland |
47.99638 |
-111.36411 |
0 |
No |
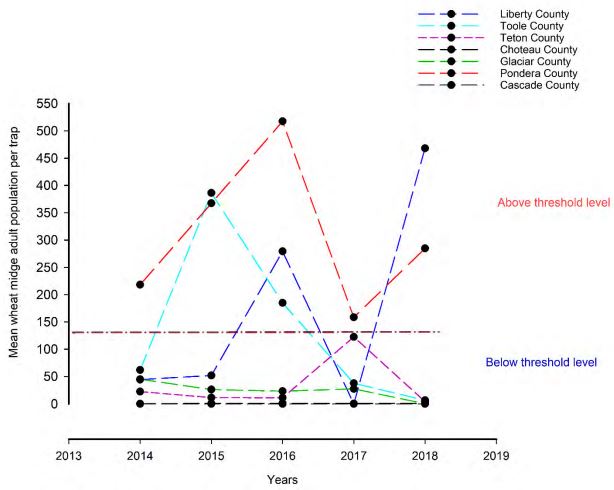
In 2018, wheat midge populations were monitored in seven counties (Liberty, Toole, Teton, Choteau, Glacier, Cascade and Pondera) at the Golden Triangle, Montana. Portion of the wheat midge count data was extracted from Pestweb Montana. Total number of wheat midge pheromone traps installed in wheat fields were 39 in 2018. Among the seven counties, the highest wheat midge population level per trap was observed in Liberty County in comparison to no presence of wheat midge in Cascade and Glacier County (Fig. 1). The second highest wheat midge populations were noticed at Pondera County followed by Toole and Teton Counties (Fig. 1). Compared to the last year, wheat midge population was low in Toole County but higher in Pondera and Liberty Counties.
Figure1. Wheat midge population levels in the Golden Triangle, Montana from 2014-2018.
Wheat midge population level: Irrigated vs. dryland spring wheat fields
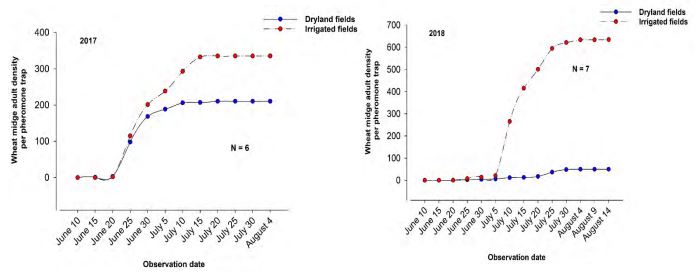
In overall, the flight activity of wheat midge adults began about one and half weeks later (June 30- July 5) in 2018 when compared to 2017 with emergence occurred on June 15-21 in Pondera County (Fig. 2). The midge adult activity reached a peak on July 15-25, 2018, and that contrasted adult emergence in 2017 (i.e., June 30- July 5) (Fig. 2). It thereby indicates that environmental conditions could influence the wheat emergence patterns. In 2018, we had similar results as like 2017 regarding wheat midge population levels in irrigated and dryland wheat fields. Wheat midge populations were relatively at higher levels in irrigated fields compared to dryland spring wheat fields. However, it is interesting to report that wheat midge population levels were nearly fourteen- fold higher in irrigated compared to dryland fields in 2018. The total cumulative numbers of male adults captured per pheromone trap were: 700 and 50 in irrigated and dryland fields, respectively (Fig. 2). In contrast in 2017, wheat midge population levels were only two folds higher in irrigated compared to dryland fields. The total cumulative numbers of male adults captured per pheromone trap were: 325 and 180 in irrigated and dryland fields, respectively (Fig. 2). Consequently, environmental factors could be the main triggering factors for wheat midge population dynamics in irrigated and dryland spring wheat fields in Montana.
Figure 2. Wheat midge adult activity based on pheromone trap catch in dryland and irrigated spring wheat fields (2017-2018).
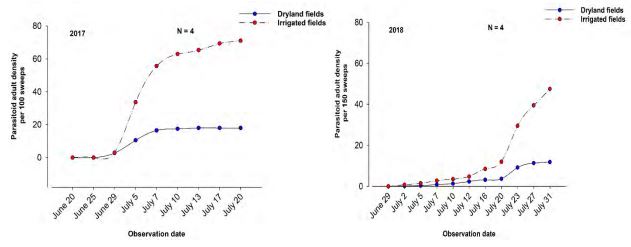
Figure 3. Wheat midge parasitoid, Macroglenes penetrans adult population levels in dryland and irrigated spring wheat fields (2017- 2018).
Parasitoid population level: Irrigated vs. dryland spring wheat fields
Based on sweep net sampling method, in 2018, Macroglenes penetrans population was observed at higher levels in irrigated compared to dryland spring wheat midge infested fields and it was also expected (Fig 3). In both management systems, the emergence of parasitoid begun nearly at the same time (July 10 - July 12, 2018) (Fig 3). As compared with previous year 2017, the M. penetrans adult population was low both in the dryland and irrigated fields in 2018. In 2018, the total cumulative parasitoid numbers per 150 sweeps were 48 and 12 respectively, in irrigated and dryland fields. Regarding to other parasitoid species P. tuberosula, we found in four irrigated and one dryland spring wheat fields of Valier, Montana but at a very low number.
Acknowledgements
This work was supported by Montana Wheat and Barley Committee. We would like to thank summer intern Bert Paulsen for assistance with field work.


