
Effects of Boron Fertilizer and Water Regimes on Alfalfa Yield and Quality
Link to Effects of Boron Fertilizer and Water Regimes on Alfalfa Yield and Quality Printable PDF
Objective:
To evaluate the effects of boron fertilizer rate and irrigation application on alfalfa yield and quality.
Personnel:
J.A. Torrion, R.N Stougaard, E. Glunk, E. Sapkota, J. Garner
Summary:
Boron treatments were applied at five rates detailed in Table 1. Three water use treatments were applied as the main factor, which included rainfed, half or deficit irrigation (50% ET), and sufficient or full irrigation (100% ET). The experimental design was a split plot with four replications. There was a full soil profile at the beginning of green up in spring as rainfall received in the fall and early spring was above average. Supplemental irrigation was applied when 35 percent of plant available water was used up. Rainfall events and amounts of irrigation applied per treatment are shown in Figure 1. Height measurements were taken prior to cutting when plants averaged 10% flowering. Two cuttings were made.
No significant differences were observed in height or yield data from boron fertilizer treatments (Table 3). Significant differences were observed for height and yield from water treatments (Table 4). The highest yield for total harvest was 2.16 T/A for 50 ET which was equivalent to the 100ET. This implies that the 50ET treatment did not impact yield as it allowed to store rainfall more efficiently (i.e., 60 DAE rainfall in Figure 1). Significant differences were observed for all but two nutrient analysis for hay quality from boron treatments for first harvest, but none for second harvest (Table 5). No significant differences were observed for hay quality from water treatments for first harvest, but significant differences were observed for second harvest (Table 6).
Table 1. Total B applied per treatment and application timing. |
||
|---|---|---|
| Treatment Total B (lb/a/year) | Application | |
| 1 | Untreated check | None |
| 2 | 0.5 | .25 lb/A applied at 3-in regrowth in early spring + .25 lb/A at 3 - in regrowth after first cutting |
| 3 | 1 | .50 lb/A applied at 3-in regrowth in early spring + .50 lb/A at 3 - in regrowth after first cutting |
| 4 | 2 | 1.0 lb/A applied at 3-in regrowth in early spring + 1.0 lb/A at 3 - in regrowth after first cutting |
| 5 | 2 | 2 lb/A applied at 3-in regrowth in early spring |
Table 2. Materials & methods |
|||
|---|---|---|---|
| Variety: | HybriForce-3400 | Soil Test: | 121-21-144 |
| Seeding Date: | 5/24/2016 | Fertilizer: | 44-104-240-20S |
| Julian Date: | 145 | Boron Fertilizer: | 0% Liquid - Agrisolutions |
| Seeding Rate: | 20 lb/A | 1st Boron Application Date: | 7/22/2016 |
| Previous Crop: | Spring Wheat | 2nd Boron Application Date: | 8/3/2016 |
| Tillage: | Conventional | 1st Harvest Date: | 7/27/2016 |
| Irrigation: | Yes | 2nd Harvest Date: | 9/17/2016 |
| Soil Type: | Fine sandy loam | ||
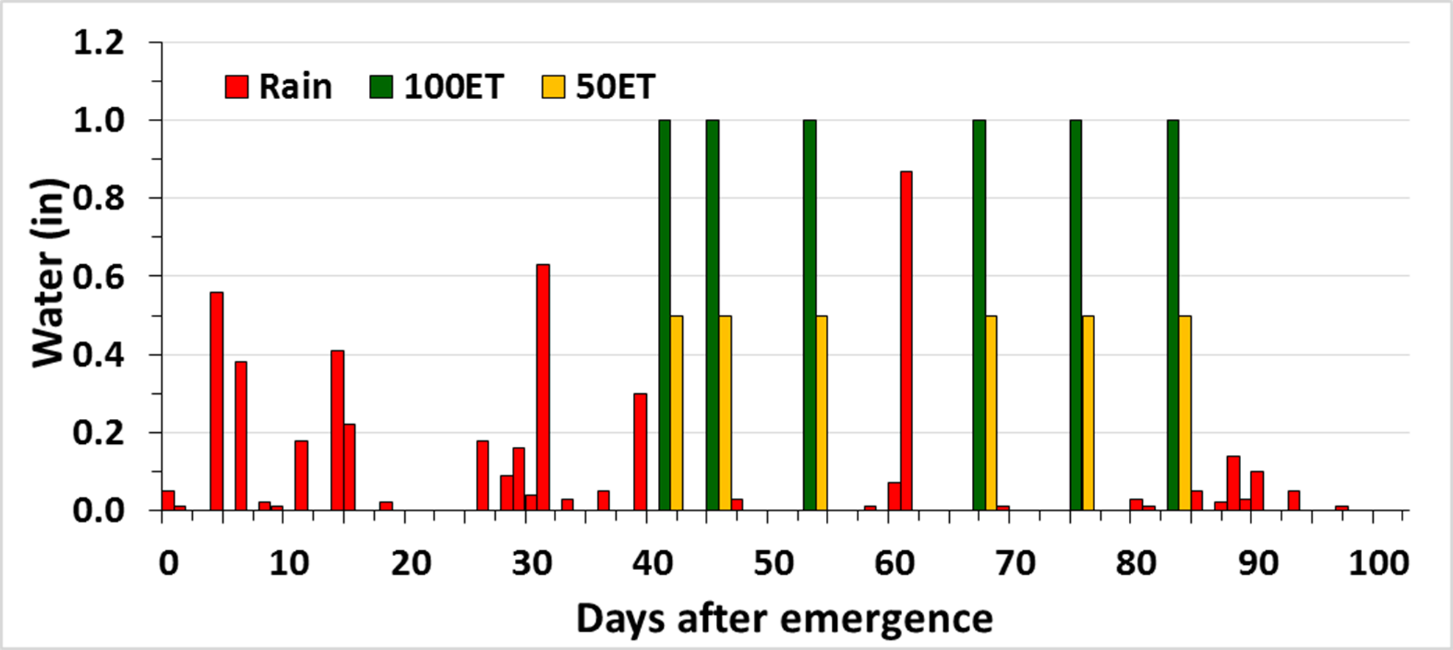
Figure 1. Rainfall events and irrigation applied per treatment.
Table 3. Effects of boron fertilizer on alfalfa yield |
|||||
|---|---|---|---|---|---|
| 1st Harvest - Jul 27 | 2nd Harvest - Sep 17 | Harvest Total | |||
| HT | YLD | HT | YLD | YLD | |
| Treatment | in | T/A | in | T/A | T/A |
| 0 lbs B | 18.98 | 0.47 | 25.18 | 1.29 | 1.76 |
| 0.25 lb B begin + mid season | 19.94 | 0.59 | 24.42 | 1.25 | 1.84 |
| 0.5 lb B begin + mid season | 19.74 | 0.56 | 24.68 | 1.32 | 1.88 |
| 1 lb B begin + mid season | 21.56 | 0.81 | 25.09 | 1.31 | 2.12 |
| 2 lb B begin season | 20.31 | 0.67 | 26.05 | 1.40 | 2.06 |
| LSD | ns | ns | ns | ns | ns |
| Pr>F | 0.4312 | 0.0854 | 0.762 | 0.8398 | 0.4581 |
| HT: height, YLD: yield, ns: nonsignificant, B: boron (amount applied begin season same as mid season) | |||||
Table 4. Effects of water on alfalfa yield |
|||||
|---|---|---|---|---|---|
| 1st Harvest - Jul 27 | 2nd Harvest - Sep 17 | Harvest Total | |||
| HT | YLD | HT | YLD | YLD | |
| Treatment | in | T/A | in | T/A | T/A |
| Dryland/Rainfed | 18.68 | 0.56 | 19.61 | 0.93 | 1.49 |
| Half Irrigation (50 ET) | 20.28 | 0.64 | 26.83 | 1.53 | 2.16 |
| Full Irrigation (100 ET) | 21.36 | 0.66 | 28.82 | 1.48 | 2.14 |
| LSD | 1.08 | 0.12 | 0.93 | 0.06 | 0.19 |
| Pr>F(0.05)-ET | 0.0004 | 0.0341 | <.0001 | <.0001 | <.0001 |
| HT: height, YLD: yield, ns: nonsignificant, B: boron (amount applied begin season same as mid season) | |||||
Table 5. Effects of Boron on hay quality |
||||||
|---|---|---|---|---|---|---|
| CP | ADF | NDF | TDN | RFV | B | |
| Treatment | % | % | % | % | % | ppm |
| 1st Harvest - Jul 27 | ||||||
| 0 lbs B | 29.03 | 24.52 | 36.67 | 72.22 | 178.58 | 30.42 |
| 0.25 lb B begin + mid season | 28.38 | 25.66 | 37.58 | 70.98 | 173.42 | 32.67 |
| 0.5 lb B begin + mid season | 28.18 | 25.58 | 35.04 | 71.08 | 185.50 | 33.58 |
| 1 lb B begin + mid season | 29.53 | 28.33 | 40.56 | 68.11 | 156.42 | 38.92 |
| 2 lb B begin season | 28.87 | 26.65 | 37.98 | 69.92 | 170.08 | 42.00 |
| LSD | ns | 1.72 | 2.45 | 1.86 | ns | 2.39 |
| Pr>F (0.05)-B | 0.5295 | 0.0424 | 0.0483 | 0.0430 | 0.0672 | <.0001 |
| 2nd Harvest - Sep 17 | ||||||
| 0 lbs B | 28.36 | 30.65 | 35.51 | 65.61 | 172.58 | 29.67 |
| 0.25 lb B begin + mid season | 26.84 | 30.26 | 35.93 | 66.04 | 171.75 | 38.75 |
| 0.5 lb B begin + mid season | 27.39 | 30.07 | 36.8 | 66.23 | 168.17 | 42.42 |
| 1 lb B begin + mid season | 27.21 | 31.45 | 37.19 | 64.74 | 164.42 | 48.58 |
| 2 lb B begin season | 26.66 | 30.86 | 37.68 | 65.38 | 160.75 | 43.25 |
| LSD | ns | ns | ns | ns | ns | 5.5 |
| Pr>F (0.05)-B | 0.1999 | 0.764 | 0.3606 | 0.7596 | 0.4952 | <.0001 |
| CP: crude protein, ADF: acid detergent fiber, NDF: neutral detergent fiber, TDN: total digestible nutrients, RFV: relative feed value, B: boron (amount applied begin season same as mid season) | ||||||
Table 6. Effects of water on hay quality |
||||||
|---|---|---|---|---|---|---|
| CP | ADF | NDF | TDN | RFV | B | |
| Treatment | % | % | % | % | % | ppm |
| 1st Harvest - Jul 27 | ||||||
| Dryland/Rainfed | 28.71 | 26.35 | 38.31 | 70.26 | 168.65 | 32.60 |
| Half Irrigation (50 ET0 | 29.20 | 26.59 | 37.73 | 69.99 | 171.25 | 35.70 |
| Full Irrigation (100 ET) | 28.48 | 25.52 | 36.65 | 71.14 | 178.50 | 38.25 |
| LSD | ns | ns | ns | ns | ns | ns |
| Pr>F(0.05)-ET | 0.3546 | 0.5045 | 0.4391 | 0.5081 | 0.3958 | 0.1333 |
| 2nd Harvest - Sep 17 | ||||||
| Dryland/Rainfed | 29.22 | 27.90 | 33.63 | 68.58 | 188.55 | 27.75 |
| Half Irrigation (50 ET0 | 26.63 | 31.74 | 38.17 | 64.42 | 157.55 | 43.80 |
| Full Irrigation (100 ET) | 26.03 | 32.33 | 38.07 | 63.81 | 156.50 | 50.05 |
| LSD | 1.25 | 0.90 | 3.01 | 0.98 | 14.76 | 5.45 |
| Pr>F(0.05)-ET | 0.0001 | 0.0002 | 0.0011 | 0.0002 | 0.0002 | 0.0002 |
| CP: crude protein, ADF: acid detergent fiber, NDF: neutral detergent fiber, TDN: total digestible nutrients, RFV: relative feed value, B: boron (amount applied begin season same as mid season) | ||||||