
Effects of Boron Fertilizer and Irrigation on Alfalfa Yield and Quality - 2017
Objective:
To evaluate the effects of boron fertilizer rate and irrigation application on alfalfa yield and quality.
Personnel:
A. Sapokta, E.C. Meccage, R.N. Stougaard, B. Bicego, J.A. Torrion
Methods:
This study was conducted to determine how much boron fertilization is needed to achieve high alfalfa yields in northwest Montana. Similarly, alfalfa is also known for its high‐water use demand. So, water regimes were added to this experiment as the main plot factor – 1) rain‐fed check, 2) fully irrigated (100% evapotranspiration, ET), and 3) partial irrigation (50ET, scheduled on the same date of application as 100ET but only half of its amount). The boron rates (subplot factor) are shown in Table 1, which were randomly assigned to plots within each of the water regimes. Other management information is shown in Table 2. Irrigation applied and precipitation received in 2017 is summarized in Figure 1.
Summary:
Boron fertilization did not impact alfalfa plant height or yield in either of the cuttings in 2017 (Table 3). However, the total yield of the season was barely influenced by B fertilization (P = 0.0583; Table 3). So, with the application of B, regardless of B rates, seemed to be nominally higher compared to the control treatment, but insignificant and is not worth the investment and time.
The first harvest was not irrigated due to the five inches rain early in the season (Figure 1). Effects of irrigation on alfalfa height and yield were significant for the third harvest and total yield of the season in 2017 (Table 4). The total seasonal yield showed increment in alfalfa yield with irrigation (Table 4). The lowest yield was for rainfed treatment (5.6 ton/A; Table 4). The deficit irrigation (50ET) and full irrigation (100ET) were not statistically significant (Table 4) which implies that irrigating alfalfa with 50% reduction of irrigation from the 100ET, produces competitive yield and water response (Figure 2) despite the risk associated with the imposed water stress.
Neither of the forage quality parameters of alfalfa was significantly influenced by irrigation. Effect of B on forage quality was significant only for NDF and RFV (Figure 3).
Table 1. Total Boron Applied per Treatment and Application Timing.
| Treatment | Total B (lb/A) | Description |
| B0 | Untreated Check | None |
| B1 | 0.50 | Split: 0.25 lb/A applied at 3-in spring growth + 0.25 lb/A at 3-in regrowth after first cutting |
| B2 | 1.0 | Split: 0.5 lb/A applied at 3-in spring growth + 0.5 lb/A at 3-in regrowth after first cutting |
| B3 | 2.0 | Split: 1.0 lb/A applied at 3-in spring growth + 1.0 lb/A at 3-in regrowth after first cutting |
| B4 | 2.0 | 2.0 lb/A applied at 3-in spring growth |
Table 2. Management Information.
| Variety: | HybriForce-3400 | Soil Test (2016): | 121-21-144 |
| Seeding Date: | 5/24/2017 | Fertilization (2016): | 44-104-240-20S |
| Seeding Rate: | 20 lb/A | Boron Fertilizer: | Liquid 10% Agri B Solution |
| Previous Crop: | Spring Wheat | First Boron Application: | 4/22/2017 |
| Tillage: | Conventional | Second Boron Application: | 6/27/2017 |
| Irrigation: | Yes | First Harvest: | 6/15/2017 |
| Soil Type: | Sandy Loam | Second Harvest: | 7/21/2017 |
| Third Harvest: | 9/9/2017 |
Table 3. Effects of Boron Fertilization on Alfalfa Plant Height and Yield - 2017.
| Treatment | 6/15 HT in. |
6/15 YLD T/A |
7/21 HT in. |
7/21 YLD T/A |
9/9 HT in. |
9/9 YLD T/A |
YLD Total T/A |
| 0 lb B | 34.89 | 1.72 | 34.65 | 2.07 | 34.75 | 2.07 | 5.86 |
| 0.25 lb B begin + mid-season | 35.38 | 1.84 | 35.13 | 2.12 | 35.14 | 2.15 | 6.11 |
| 0.5 lb B begin + mid-season | 35.17 | 1.83 | 35.28 | 2.13 | 34.95 | 2.11 | 6.07 |
| 1 lb B begin + mid-season | 36.08 | 1.87 | 35.73 | 2.12 | 34.07 | 2.14 | 6.12 |
| 2 lb B begin season | 36.17 | 1.82 | 35.99 | 2.17 | 34.70 | 2.13 | 6.12 |
| Pr>F (0.05)-B | 0.5416 | 0.1410 | 0.3236 | 0.4395 | 0.6974 | 0.7530 | 0.0583 |
Table 4. Effects of Irrigation on Alfalfa Plant Height and Yield - 2017.
| Treatment | 6/15 HT in.* |
6/15 YLD T/A |
7/21 HT in. |
7/21 YLD T/A |
9/9 HT in. |
9/9 YLD in. |
YLD Total T/A** |
| Rainfed | 35.89 | 1.79 | 34.91 | 2.14 | 30.36b | 1.67b | 5.60b |
| Deficit Irrigation (50ET) | 35.55 | 1.83 | 35.60 | 2.14 | 36.39a | 2.30a | 6.28a |
| Full Irrigation (100ET) | 35.17 | 1.81 | 35.57 | 2.08 | 37.43a | 2.39a | 6.29a |
| Pr>F (0.05)-ET | -- | -- | 0.1090 | 0.3715 | 0.0023 | 0.0017 | 0.0123 |
* First cutting in 2017 was not irrigated
** Sum of yield from all cuttings, including the first cut which was not irrigated
Different letter assignment in a column are significantly different at P <0.05
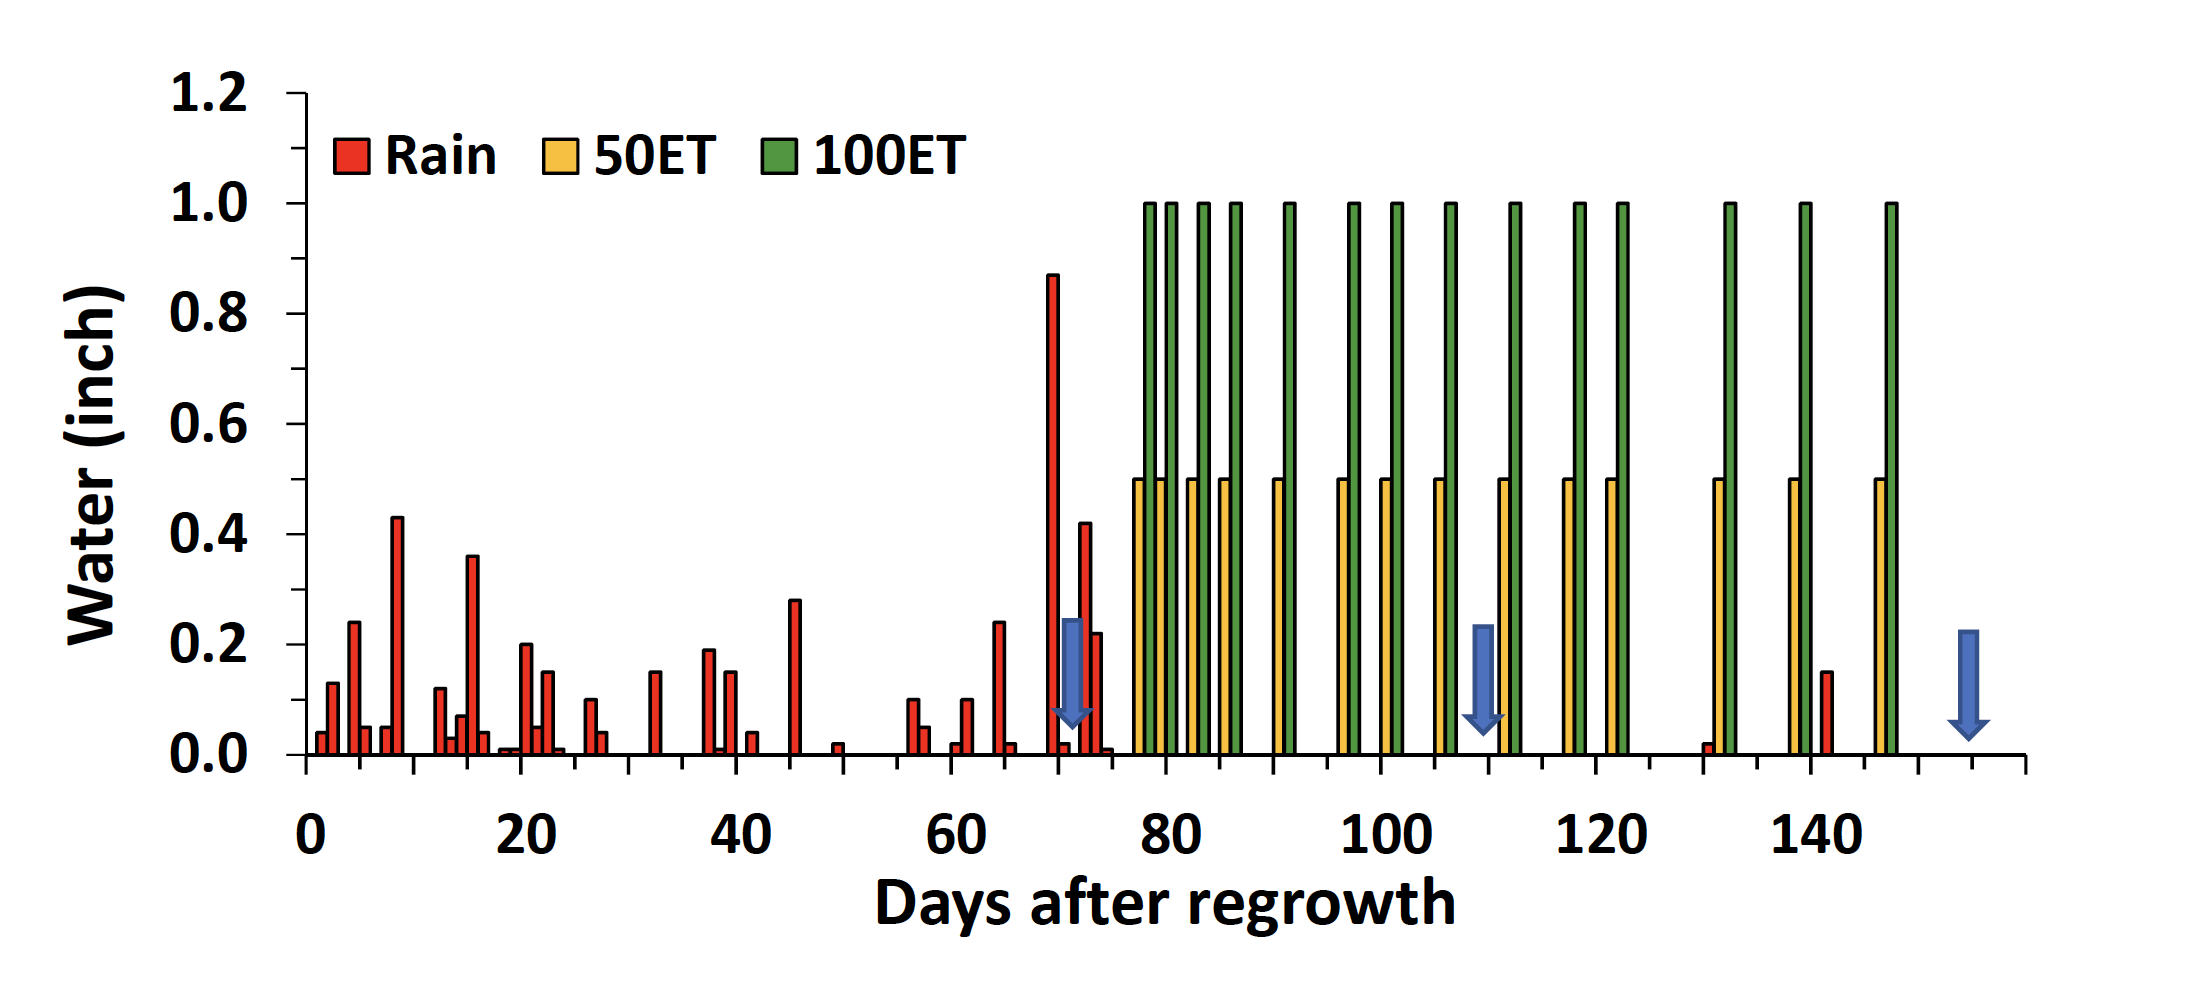
Figure 1. Rainfall received, and amount of irrigation applied in 2017. The 100 percent evapotranspiration (100ET) was irrigated with no stress and 50 ET is only half of the 100ET irrigation events. Blue arrows on the x-axis shows the cutting events. Alfalfa was not irrigated before first cutting.
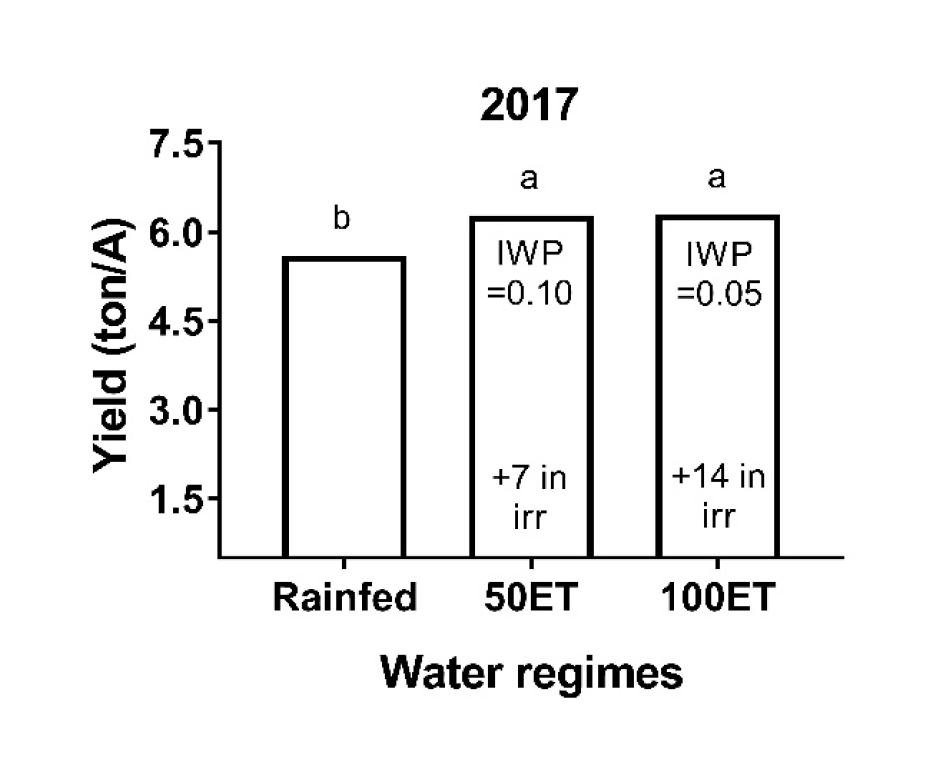
Figure 2. Effects of irrigation on alfalfa total yield and irrigation water productivity (IWP tons/in irrigation) in 2017.
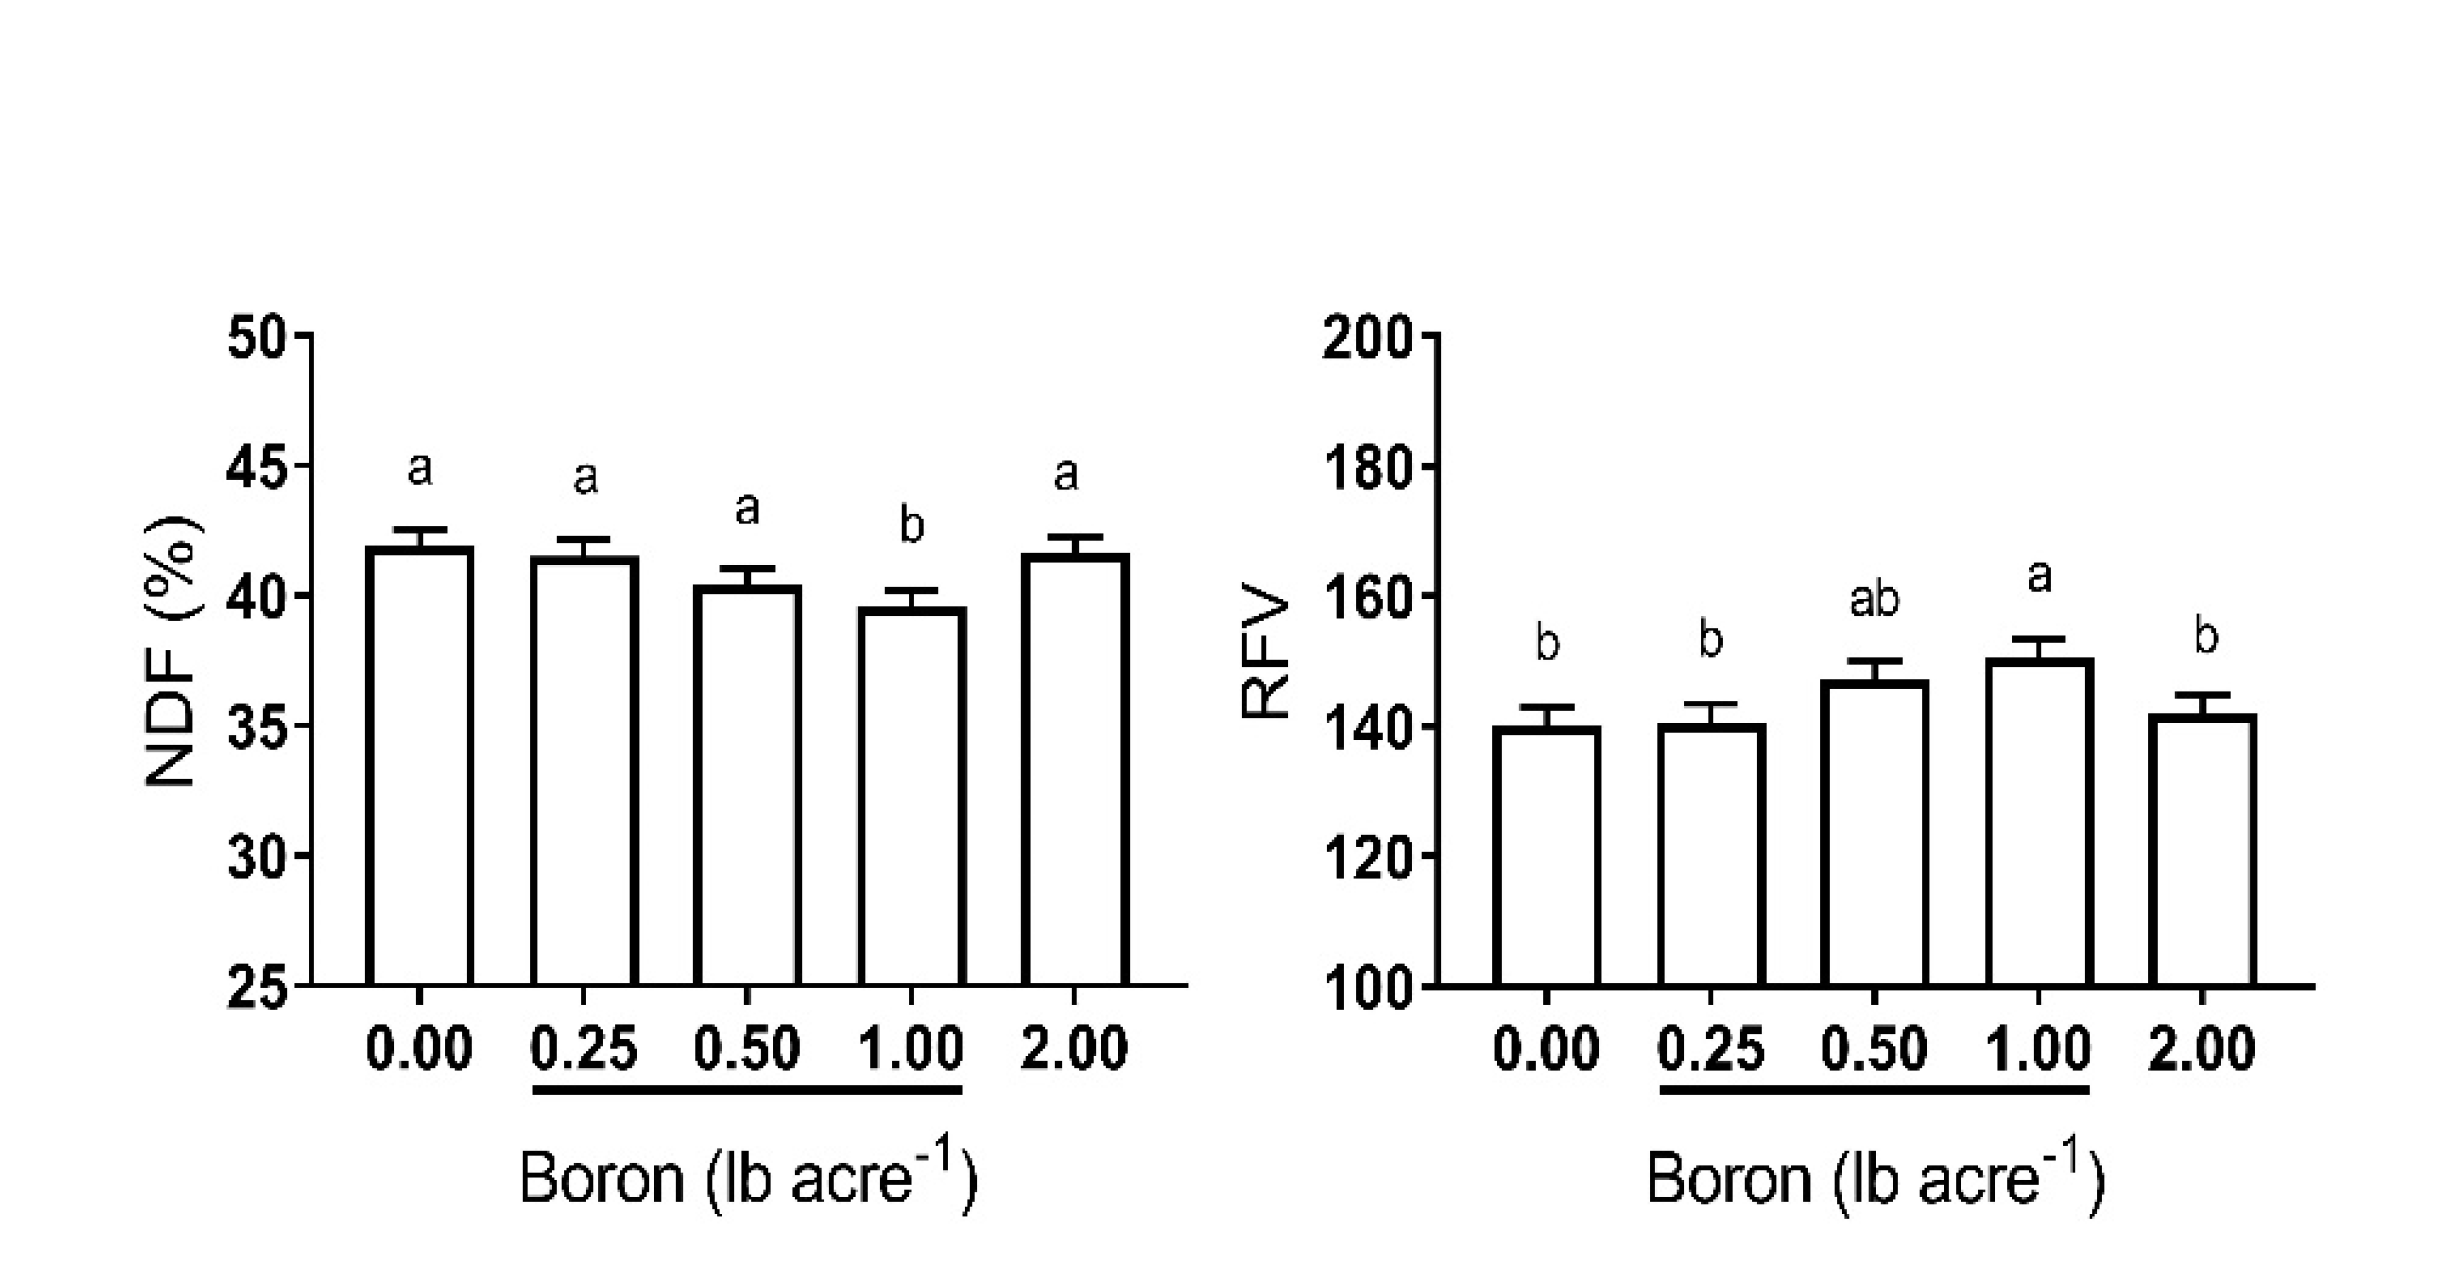
Figure 3. Effects of Boron (B) on neutral detergent fiber (NDF), and relative feed value (RFV) in 2017. Underlined B rates were re-applied after first cutting. Different letters within the graph are significantly different at P < 0.05. Data presented are averaged valued across cuttings.