Berry qualities, ripening evenness, and resiliency to mechanical harvest damage
Introduction
Little information is available to prospective haskap growers regarding selection of North American haskap cultivars based on fruit characteristics such as resiliency to various harvesting practices. Prior to this study, it was also unclear whether mechanically-harvested fruit would be acceptable for fresh market sales. We report data on fruit quality that could influence fresh market or processing compatibility, including fruit resilience to mechanical damage in a small scale “shake-and-catch” harvest, durability in laboratory experiments simulating mechanical harvest, evenness of soluble solids content (SSC) (approximating fruit ripening evenness), postharvest stem scar wetness, and postharvest retention of flowers, stems, and leaves. In addition, we characterize haskap fruit cultivars with measures of berry weight, dimensions, firmness, and skin elasticity, titratable acidity, and pH. Based on initial in-field assessment with the small-scale “shake-and-catch” harvest method, we do not recommend planning for fresh market sales when using this type of mechanical harvesting. Laboratory mechanical harvest simulations indicated that ‘Aurora', ‘Borealis', ‘Blue Goose', ‘Keiko', and ‘Solo’ were more resilient than other cultivars tested. In general, larger, firmer fruit were more susceptible to damage; however, these experiments may not have adequately simulated the physical forces of mechanical harvest.
Methods
Haskap fruit for this study were sourced from the cold hardy fruit trial at Montana State University – Western Agricultural Research Center (MSU-WARC) in Corvallis, Montana. In 2015, nine plants of each of 15 cultivars (Table 1) were planted in a randomized complete block design, with three blocks and three plants per cultivar per block, totaling 135 plants. Plants were minimally pruned in the late winter months of 2020 to remove broken and low branches to facilitate ease of harvest.
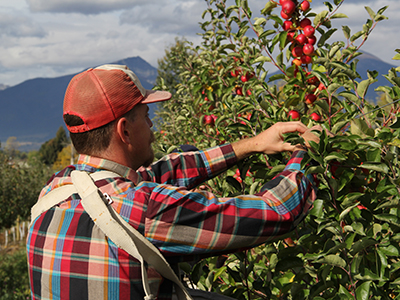
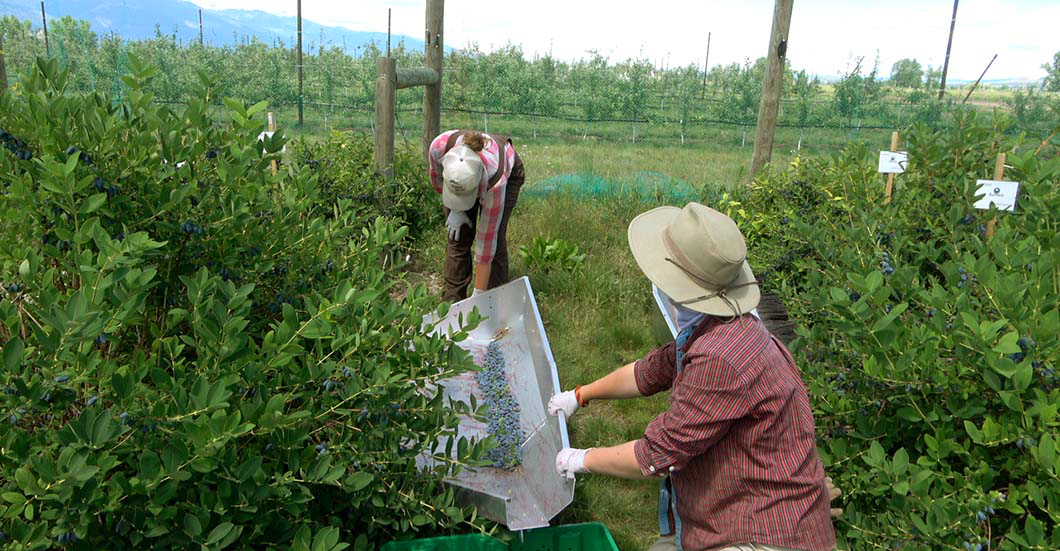
In 2019, one 6-oz (by volume) random sample container of fruit was obtained for laboratory testing following either hand harvest or mechanical harvest “shake-and-catch” from each of two plants per cultivar for genotypes 85-19, ‘Aurora', ‘Blue Goose', ‘Chito', ‘Indigo Gem', ‘Kawai', SoloTM, ‘Sugar Mountain Blue', 'Tana', and ‘Wild Treasure’ following harvest. Workers were not given special instructions to be gentle in handling fruit. The shake-and-catch harvest method involved shaking individual shrubs with a reciprocating saw equipped with a forked attachment and catching fruit in either a modified plastic kiddie pool or the metal “wings” from the Indigo Waxwing harvester.
Video demonstrating this harvest method:
Partway through the harvest season, we observed that “person harvesting” as well as “time of day” were factors contributing to fruit damage, which informed our harvest methods for 2020. Note that a plant growth regulator treatment was applied to one plant per block per cultivar, but these plants were excluded from the 2019 experiments and analyses presented here.
In 2020, haskap fruit assessment was designed as a completely randomized experiment with cultivar as the variable. Sixteen fruit from each of the nine plants for each cultivar in the field trial were hand harvested; workers attempted to collect fruit representative of the whole plant (from all sides, upper and lower, interior and exterior portions of the canopy). Based on our experience from 2019, we modified our hand harvest method to utilize careful and consistent workers and scheduled harvests during the cool morning hours between 6 and 7 a.m. to better preserve fruit quality. Harvested fruit from all plants of each cultivar were pooled in a collection bin for a total of approximately 144 fruit per variety. Fruit were then selected at random from the bin for subsequent lab measurements.
For all cultivars in 2019 and 2020, we collected random samples of harvested fruit and recorded weight (g), length (mm) and width at the thickest part of the fruit perpendicular to the stem (mm); retention of dried flowers and/or leaves (Figure 1); and stem attachment characteristics (wet, dry, or stem attached). Skin elasticity (N) and Brix or flesh firmness (N) and Brix for individual fruits were measured on separate sets of fruit since these procedures destroy fruit. Juice pH and titratable acidity were also recorded. More details on these procedures are provided below.
In 2019 trials, we documented haskap dry matter content for all cultivars by weighing fruit in sets of 10 and drying them in a dehydrator at 150 ˚F until weights stopped fluctuating (n = 6 [sets of ten fruit]). On harvest days, we recorded damage to fruit according to harvest method (Figure 4A). However, we observed that damage became more apparent during storage (Figure 4B); therefore, we added day-after-harvest assessments to 2020 measures of fruit durability.
In 2020, besides the assessments mentioned above, we added a fruit durability test (“drop-and-roll”) in an effort to simulate the dropping and rolling actions that impact berries during mechanical harvest. This procedure involved dropping individual fruit from a height of 7 ft (2.13 m) followed by rolling each fruit down a 10 ft-long (3.05 m) x 4.75 in (12.065 cm) diameter plastic pipe angled at approximately 45°. Each fruit was immediately assessed for damage following the drop-and-roll (“no damage”=0, “damage”=1), placed on trays in individual cells, stored overnight in a cold room cold room (34 ˚F [1 ˚C] / 98% relative humidity [RH] as measured by a Hobo data logger (Onset Computer Corporation)), and reevaluated for damage. As we wanted to control for fruit damaged by hand harvesting versus through the drop-and-roll experiment, a set of fruit that were not dropped-and-rolled was also assessed for damage the day of harvest and similarly placed in cold storage overnight to be reevaluated the following day.
Video demonstrating the berry "drop-and-roll":
Dr. Rachel Leisso first drops a haskap berry from a height of 7 ft., then rolls it down a 10-ft. pipe angled at approximately 45°, and examines the berry for damage.
Berry skin elasticity and firmness were collected using a FR-5120 Digital Fruit Firmness Tester (QA Supplies, Norfolk, VA) equipped with a 2 mm probe mounted on a stand. Measurements were collected in “fast” and “Peak H” mode. This type of device—even when mounted on a stand—can produce variable results due to user technique. Particularly in 2020, we gave more attention to standardizing methods and attempted to utilize the same worker to measure skin elasticity and flesh firmness throughout the trial. Skin elasticity was tested by placing fruit on its flattest side and depressing the penetrometer until the skin was punctured. Fruit firmness was measured on a different set of fruit by placing fruit on its non-flat side (so that one side of the two-berries-within-a-berry would be facing up to the penetrometer as depicted in Figure 2), removing the smallest amount of skin possible to expose berry flesh, and depressing the penetrometer. Brix readings were collected for juice obtained from individual fruit following penetrometer measurements with a Hanna hand-held refractometer (HI 96822, Hanna Instruments).
Sufficient juice volume for measuring titratable acidity and pH was achieved by pooling ten fruit per cultivar for each of the fruit sets tested for skin elasticity or flesh firmness. The pooled fruit were placed in small ZiplocTM bags and macerated by hand to release the juice. A corner of the bag was removed so that juice could be drained into several 2 mL centrifuge tubes and centrifuged at 13,000 x g to deposit sediment. The supernatant was decanted and used in pH and titration on a Hach AT1000 potentiometric titrator (Model AT1102) equipped with an autosampler (AS1000) and using the pH IntelliCALTM PHC281 pH Ultra Refillable pH electrode (Hach Inc., Loveland, CO). Juice samples were titrated to pH 8.2 with 0.25 M NaOH. Results are expressed in g citric acid per L of solution, as citric acid is the predominant acid in for haskaps (Rupasinghe et al., 2018).
Since we neither recorded nor accounted for the confounding factors of “worker harvest technique” and “time of day” factors throughout the 2019 season, all recorded damage was attributed to harvest method (excluding the factor genotype or cultivar). We then tabulated results in contingency tables (number of fruit in the “damage” versus “no damage” condition) and analyzed for “goodness of fit” according to chi-square distribution, where the null hypothesis is that there is no difference between the observed (damage versus no damage) and expected (damage versus no damage) frequencies. Fruit dry matter content is reported as percent dry matter according to cultivar.
For 2020, fruit damage data were analyzed with a binary logit model (Fisher’s scoring optimization technique) via PROC LOGISTIC in SAS. Where Wald’s chi-square test statistic indicated cultivar significance; follow-up cultivar comparisons were performed with pairwise contrast statements. A comparison of day-of-harvest versus day-after-harvest damage was analyzed with the chi-square test statistic in SAS via PROC FREQ. We also performed partial least squares discriminant analysis (PLS-DA) via MetaboAnalyst (Chong et al., 2019). Direct correlations of the fruit’s physical and qualitative parameters were not possible due to mutually exclusive destructive sampling (e.g. skin elasticity, fruit firmness, Brix, and fruit drop-and-roll). Therefore, we modeled percent fruit damaged for each cultivar in ranges of 0-25%, 26-50%, 51-75%, and 76-100%.
Flower retention, stem scar wetness, and stem and leaf attachment were analyzed via chi-square analysis. Where the Chi-square test statistic was significant at p <0.05, post-hoc tests with Bonferroni’s adjustment for multiple testing comparison were performed. Chi-square test statistics are reported below the table in the form (degrees of freedom, sample size) = chi-square test statistic and p-value.
Length, width, weight, skin elasticity, flesh firmness, Brix, pH, and TA were analyzed using the Statistical Analysis System (SAS) (version 9.4, SAS Institute, Cary, NC). Assumptions of normality were assessed using the Shapiro-Wilk test statistic performed with PROC UNIVARIATE. Where testing several transformations did not correct data to meet the assumption for normality, the non-parametric Kruskal-Wallis test was performed. Homogeneity of variances were tested per Levene’s test; if cultivar variances were non-homogenous, then Welch’s ANOVA (unknown) was used. Tukey’s post-hoc test was used to establish means separation and is equivalent to the Games-Howell test (2019) which does not require homogeneity of variance. Ridge plots were produced in R (Team, 2017) using packages ggplot2 (Wickham, 2009) and ggridges (Wilke, 2021).
Results
Only the data tables are presented below; full manuscript is forthcoming.
Table 1. MSU-WARC haskap cultivars, genotype source, and harvest dates. AR = Berries Unlimited (Arkansas, United States), Eastern Europe (EE), OR = Oregon (Dr. Maxine Thompson); SK = Saskatchewan (University of Saskatchewan, Dr. Bob Bors).
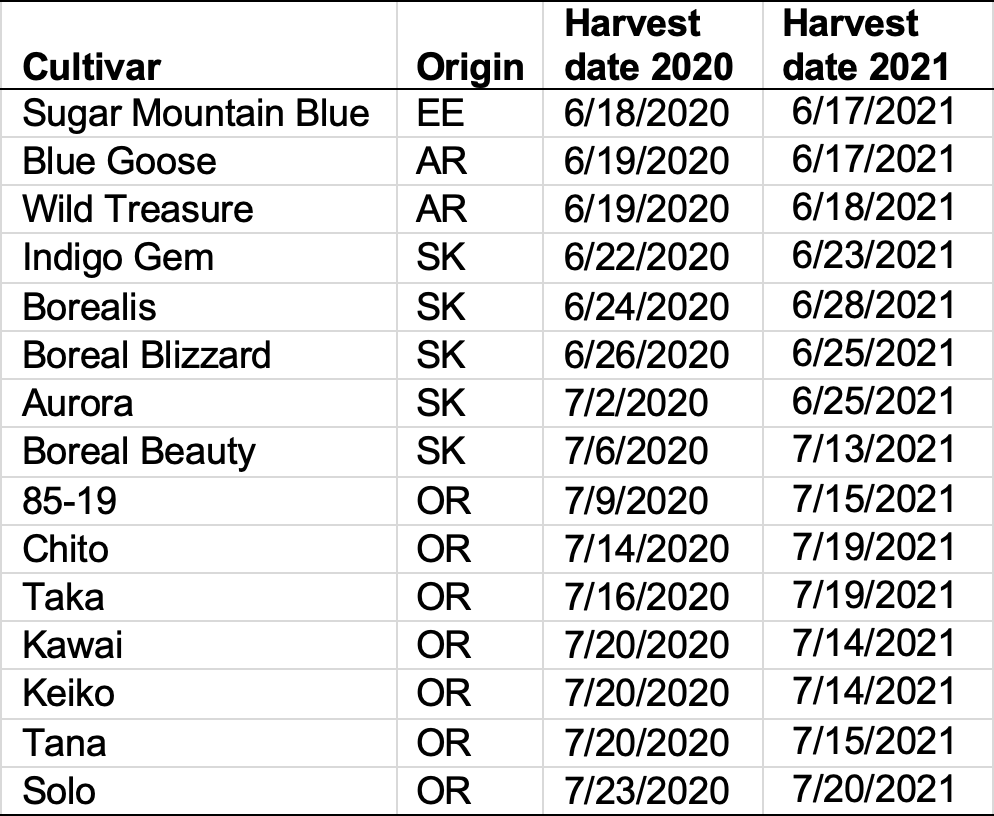
Table 2. Fruit damaged by laboratory drop-and-roll procedure. Damage outcomes day-of-drop, day-after-drop, and juice loss day-after-drop were compared in a binary logit model with Fisher’s scoring optimization technique. Where the Wald chi-square test statistic was significant at p <0.05, post-hoc comparisons were performed with pairwise contrast statements among cultivars differing from the expected frequency in the overall model. Wald’s chi-square test statistics are reported below the table in the form (degrees of freedom, sample size) = Wald chi-square test statistic and p-value. Values in a column followed by different letters were different at p < 0.05.
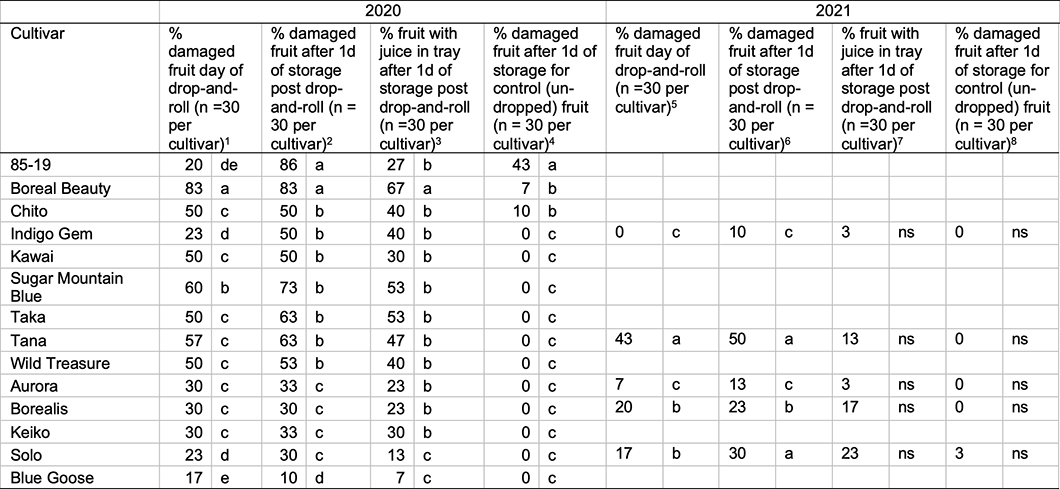
Χ2 (13, 420) = 58.84, 0.0005
Χ2 (13, 419) = 62.12, <0.0001
Χ2 (13, 419) = 39.60, 0.0002
Χ2 (2, 420) = 12.7, 0.0017
Χ2 (2, 180) = 22.89, 0.0001
Χ2 (2, 180) = 13.96, 0.0078
Χ2 (2, 180) = 8.04, 0.0902
Χ2 (2, 180) = 2.04, 0.7283
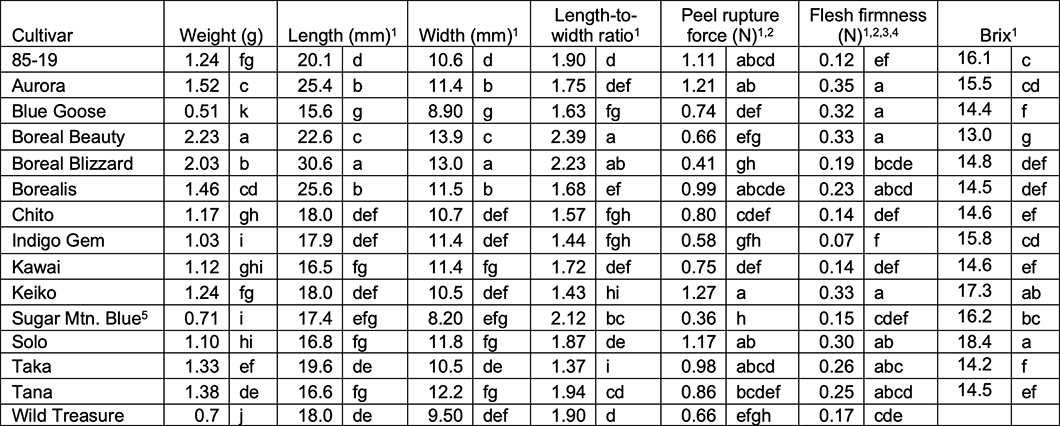
Table 3. Summer 2020 - average day-of-harvest fresh berry weights (n = 60), dimensions (n = 30), length-to-width ratio (lower numbers indicates rounder berries) (n=30), peel rupture force (n=30), firmness (n=30), Brix (n = 60) according to haskap cultivar.
-
The cultivar variances were non-homogenous and hypothesis testing for differences among cultivars was performed per Welch’s ANOVA, which is robust to non-homogenous variances.
-
Peel rupture force and firmness were measured with a digital “hand-held” penetrometer (FR-5120) mounted on a manual test stand. This type of penetrometer is more prone to user influence than more advanced penetrometer models.
-
Data were non-normally distributed and were transformed prior to analysis but untransformed means are presented.
-
Flesh firmness is very low as the interior texture is reminiscent of locular jelly in fruit like tomatoes.
-
Sugar Mountain Blue
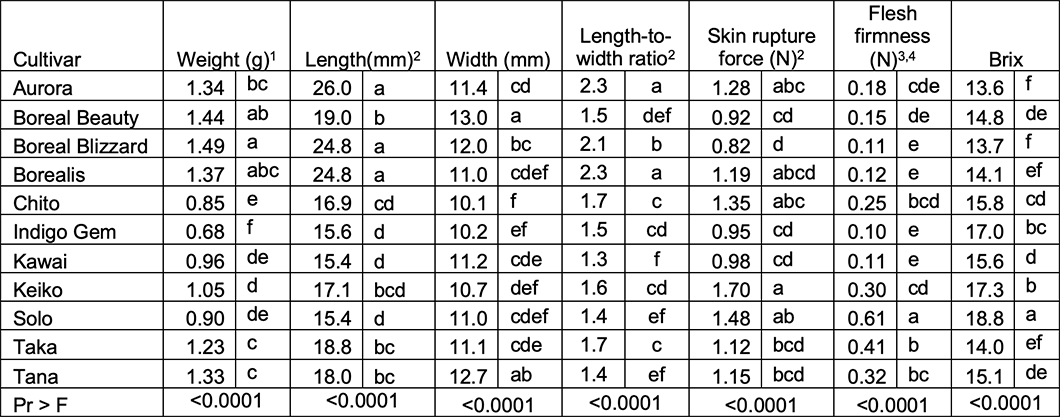
Table 4. 2021 - Average day-of-harvest fresh berry weights (n = 60 berries), dimensions (n = 30), length-to-width ratio (lower numbers indicate rounder berries), peel rupture force (n = 30), firmness (n = 30), Brix (n = 60) in 2021. In 2021, cultivars Blue Goose, Sugar Mountain Blue, and Wild Treasure were excluded due to low yields, small berry size, bitter flavor, as well as being poorly suited for Montana due to early leaf-out and subsequent frost damage over several years. Dr. Thompson’s line, 85-19, was not included due to lack of public availability.
-
The cultivar variances were non-homogenous and hypothesis testing for differences among cultivars was performed per Welch’s ANOVA, which is robust to non-homogenous variances.
-
Data were non-normally distributed and were transformed prior to analysis but untransformed means are presented.
-
Data non-normal and not corrected by transformation; non-parametric analysis with Wilcoxon’s Z test statistic and the Dwass, Steel, Critchlow-Flinger method (DSCF) pairwise multiple comparison analysis performed.
-
Flesh firmness is very low as the interior texture is reminiscent of locular jelly in fruit like tomatoes.
Table 5. Flower, leaf, and stem attachments, 2019 (n = 60, except for ‘Chito’ and Taka, where n = 30) and 2020 (n = 120 fruit per cultivar). Where the chi-square test statistic was significant at p <0.05, post-hoc tests with Bonferroni’s adjustment for multiple testing comparison were performed; per this analysis, values that exceed expected frequencies are indicated by bold text followed by “*”. Chi-square test statistics are reported below the table in the form (degrees of freedom, sample size) = chi-square test statistic and p-value.
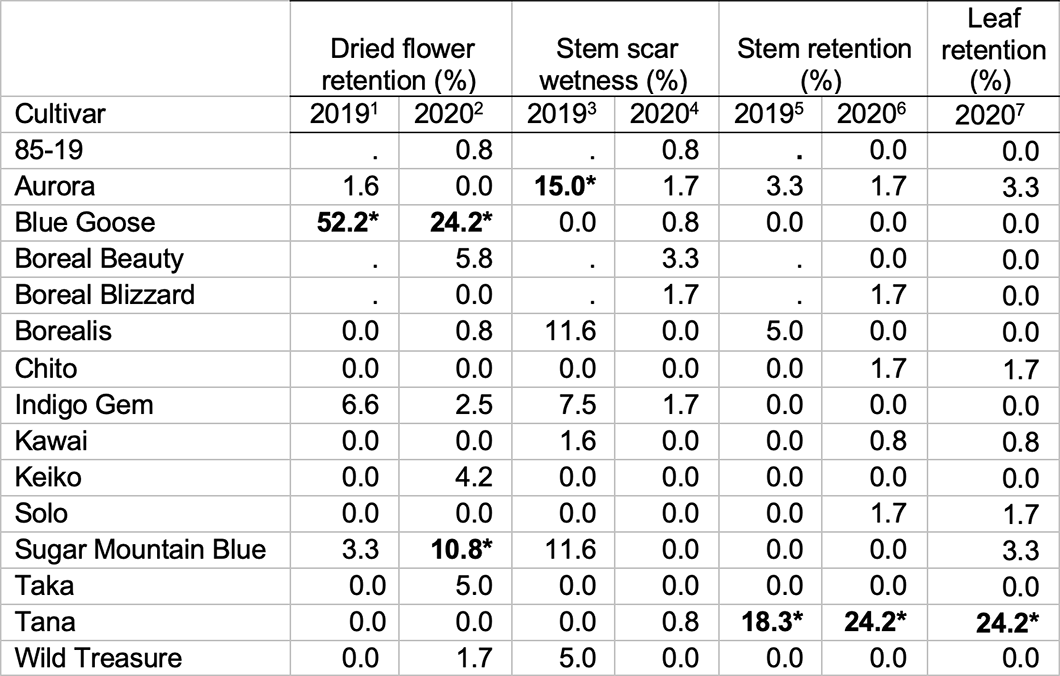
- Χ2 (13, 420) = 302.7, 7.12 x 10-48
- Χ2 (14, 1800) = 189.76, 5.85 x 10⁻²⁶
- Χ2 (14, 900) = 55.38, 0.0015
- Χ2 (14, 1800) = 22.93, 0.75 (not significant)
- Χ2 (14, 900) = 104.08, 1.06 x 10⁻¹⁰
- Χ2 (14, 1800) = 307.17, 9.24 x 10-49
- Χ2 (14, 1800) = 279.52, 2.75 x 10-43
Table 6. 2020 - pH and titratable acidity (TA) juice for haskap cultivars. Each juice sample was comprised of the juice of 10 fresh berries (n = 6 juice samples each cultivar). Brix was not measured on juice samples in 2020; no Brix-to-acid ratio is reported.
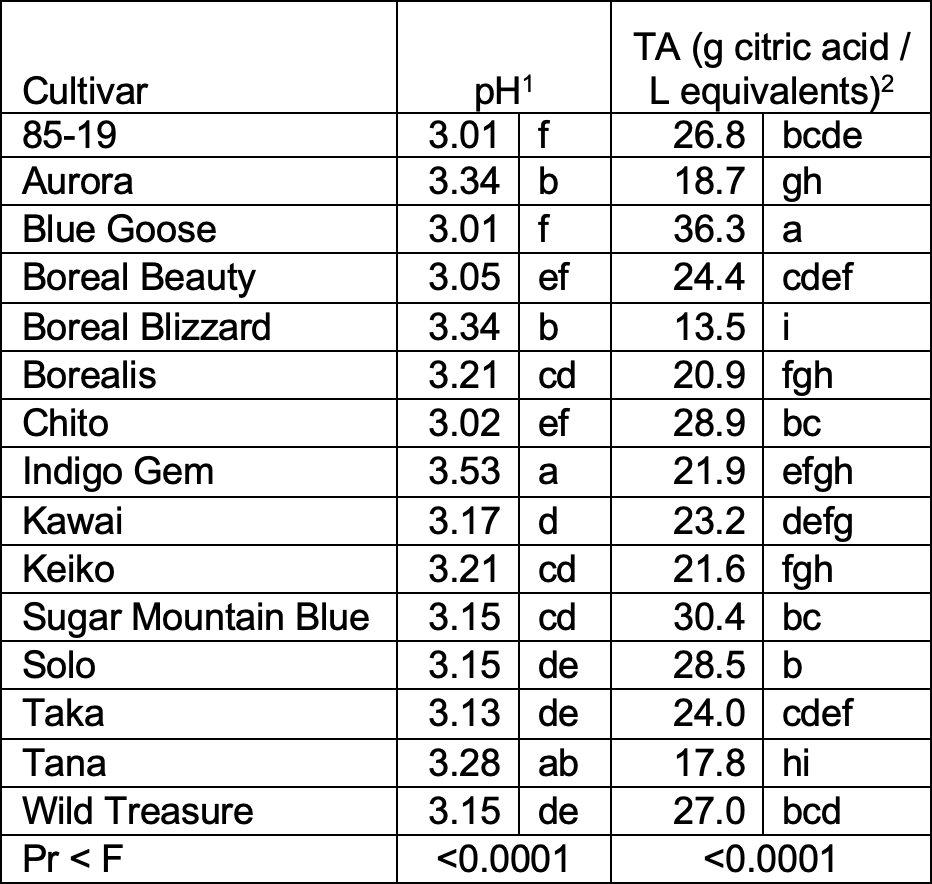
- Data non-normal and not corrected by transformation; non-parametric analysis with Wilcoxon’s Z test statistic and the Dwass, Steel, Critchlow-Flinger method (DSCF) pairwise multiple comparison analysis performed.
- The cultivar variances were non-homogenous and hypothesis testing for differences among cultivars was performed per Welch’s ANOVA, which is robust to non-homogenous variances.
Table 7. 2021 - pH, titratable acidity (TA), Brix, and brix-to-acid ratio (B:A) juice characteristics. Each juice sample was comprised of the juice of 10 fruit (n = 6 juice samples per cultivar).
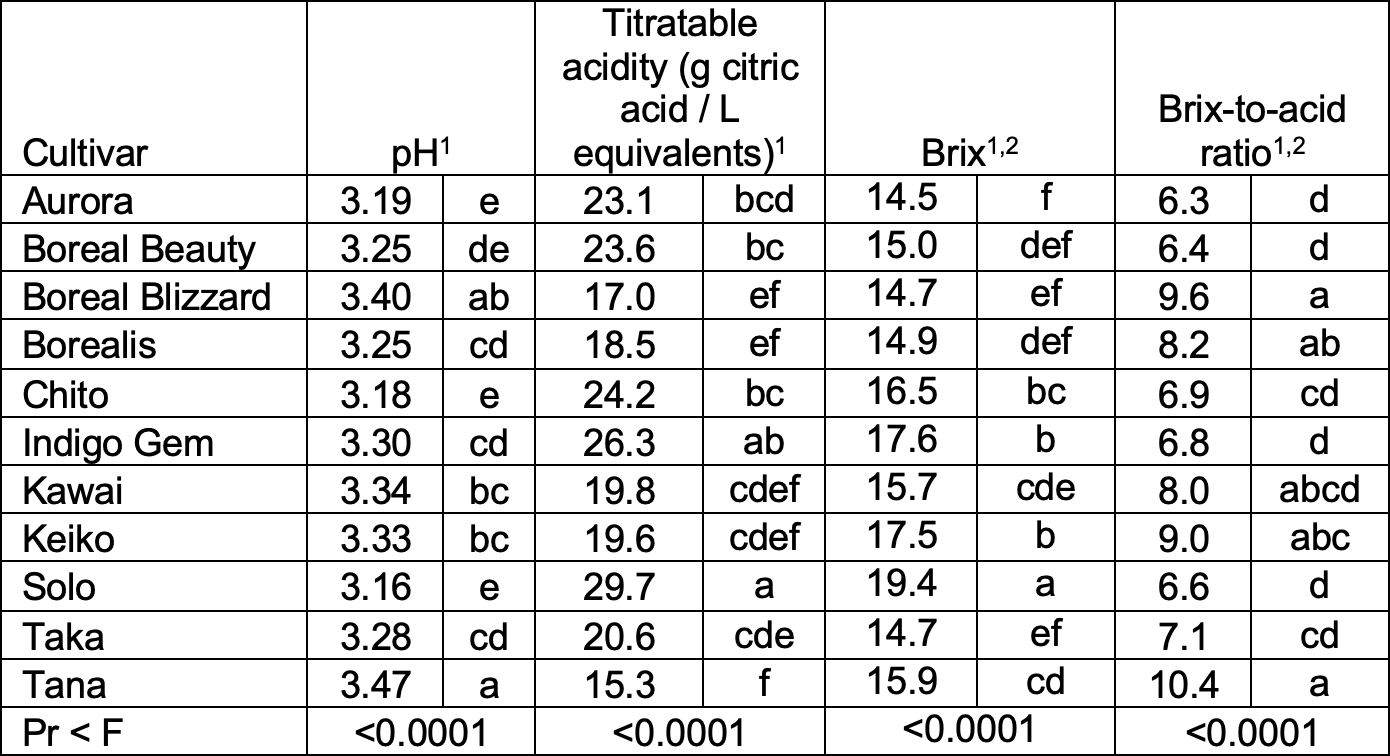
- The cultivar variances were non-homogenous and hypothesis testing for differences among cultivars was performed per Welch’s ANOVA, which is robust to non-homogenous variances.
- Non-normal distribution; data were transformed for analyses; untransformed means presented.
Table 8. 2021 - In-field berry damage according to harvest and cleaning method, plus shrivel.
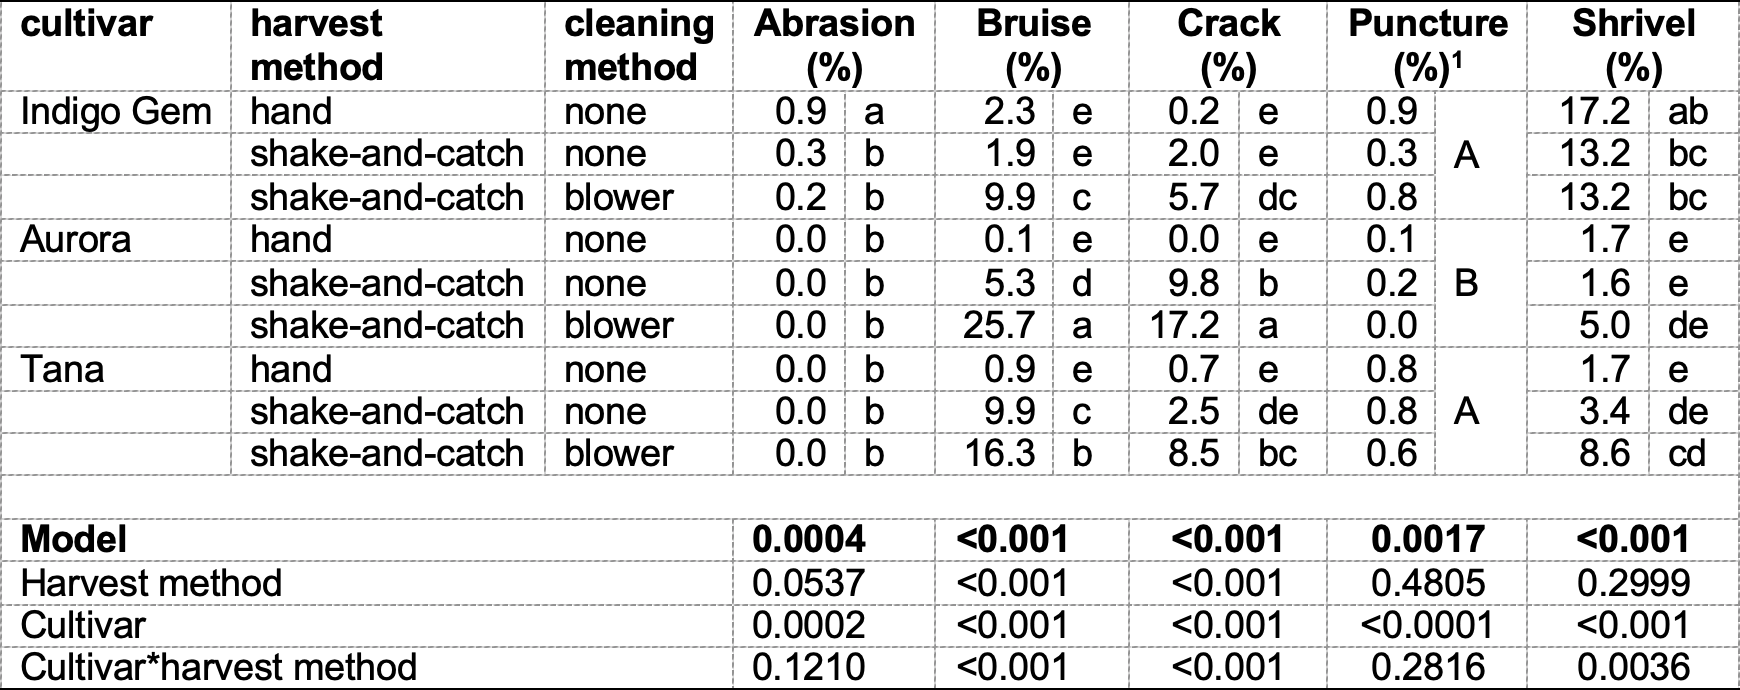
- Significance is listed according to the main effect of cultivar as neither harvest method nor the interaction effect (cultivar*harvest method) are significant.